6.2: Air Pressure
- Page ID
- 15186

Pressure variations across the Earth
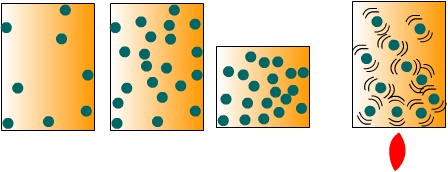
Air pressure is the force exerted by the weight of a column of air above a particular location. To conceptualize the notion of air pressure, imagine a sealed container full of air as shown in Figure \(\PageIndex{1}\). When the molecules of air collide with the inside surfaces of the container they exert a pressure. The amount of pressure they exert depends on the number of collisions that occur between the molecules and the inside surface of the container. We can change the pressure in two ways. First, we can increase the density of the air by either putting more air molecules into the container or reducing the volume of the container. Secondly, we can increase the temperature of the air to make the molecules move faster and thus collide with the sides more often. Therefore, changes in air pressure can come about by changes in air density or temperature.
In nature, pressure variations across the surface of the Earth are created by mechanical or thermal means. Mechanical changes in pressure occur when air flow is impeded causing a mass of air to build up over a particular location thus increasing air pressure. Heating and cooling the air (thermal mechanisms) also create variations in air pressure. When air is heated it rises, and if pushed away aloft, surface air pressure decreases. Conversely if air is cooled, it subsides toward the surface causing air pressure to increase.
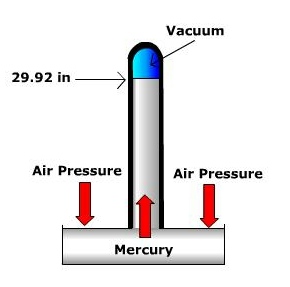
Air pressure is measured using a barometer. Several different barometers exist, two of the most common are the mercury barometer and the aneroid barometer. The mercury barometer is a tube with a reservoir of mercury at one end. Under average sea level conditions, the atmosphere exerts enough pressure to push a column of mercury up to the height of 29.92 inches. The aneroid barometer uses an aneroid or sylphon cell to measure pressure. The aneroid cell is a metal chamber that expands and contracts with changing air pressure. Though inches of mercury are often reported on your daily weather forecast (especially in the United States), meteorologists use millibars as the units of measurement for air pressure. Under average sea level conditions the atmospheric pressure is 1013.2 millibars (29.92 inches of mercury). Average sea level pressure serves as the division between what we call "high pressure" and "low pressure" at the surface. High pressure is defined as values greater than 1013.2 mb and low pressure is below 1013.2 mb.
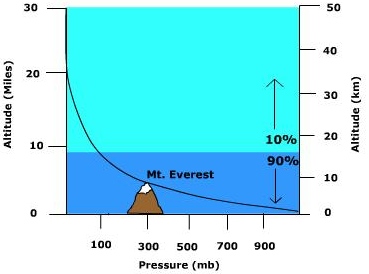
Air pressure decreases as one moves upward through the atmosphere because the length of the column of air shortens and hence there is less mass above a given location. However, the rate of decrease is not the same between two elevations (Figure \(\PageIndex{3}\)). Because air is highly compressible, the air is closely packed together near the surface (high density) and less densely packed aloft. In fact, over 90% of the atmosphere is found below 10 miles. As a result, the air pressure decreases more rapidly between two elevations close to the surface than between two points separated by the same distance aloft.
As explained previously, we use an average value of sea level pressure to differentiate between high pressure and low pressure. Because air pressure decreases aloft, the average pressure at any point above the surface is less. At 5600 meters the average pressure is 500 mb. If on any given day the pressure is larger than 500 mb we consider it high pressure at this elevation. If we measure a smaller amount then it is low pressure at this elevation. Do not confuse high pressure with higher pressure and low pressure with lower pressure. Adding the "er" to the end of the word indicates a change relative to a previous state. For instance, lets say you measure the air pressure to be 1015 mb at the surface and 516 mb at 5600 meters. Both cases are under the influence of high pressure at their respective locations. However, the pressure is higher at the surface than at 5600 meters.
Analyzing air pressure patterns
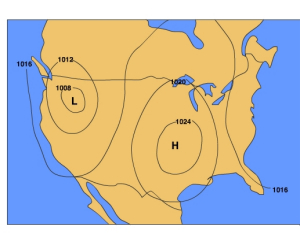
Meteorologists have a variety of ways to visualize weather data, a map being the most common. To analyze pressure patterns, a constant height map is often used. A constant height map (also known as a "constant height chart") shows the distribution of pressure at sea level. Isobars, lines connecting points of equal air pressure are used to show pressure patterns on constant height maps. Most of the maps of air pressure in this book are constant height maps.
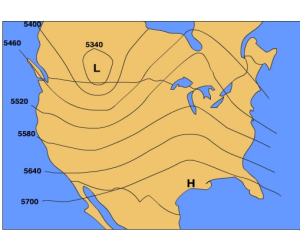
Another map that is used to analyze pressure patterns is called a constant pressure map (also known as a "constant pressure chart"). A constant pressure map shows the change in elevation of an isobaric surface which is a surface upon which the pressure is the same at all locations. By examining the height of an isobaric surface relative to it's normal elevation, one can discern where areas of high and low pressure are.
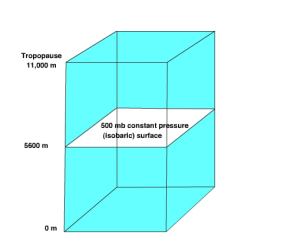
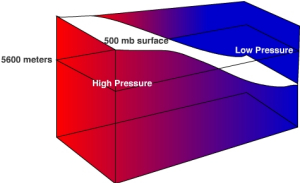
The 500 mb surface is commonly used to by meteorologists in weather forecasting. The normal height of 500 mb surface is 5600 meters. Recall, that at the surface we consider high pressure to be greater than normal sea level pressure and low pressure to be less than normal sea level pressure. In a similar way we can use the normal height of the 500 mb surface to identify where high and low pressure areas are located.
Let's consider a simple situation to understand how the height of an isobaric surface relates to air pressure. Recall that air pressure is related to force exerted by the weight of a column of air above a given point. If air temperature varies through any part of an air column, the density and pressure will also vary. Figure \(\PageIndex{7}\) shows a column with warm air to the left and cool air to the right. The 500 mb surface is shown as the white surface dipping from left to right. Let's assume that the surface pressure remains constant. When air is heated it becomes bouyant causing it to rise and when cooled it sinks. As the warm air rises more air molecules will be found above 5600 meters than normal and thus the 500 mb surface is found at a higher elevation. To the right where cold air has sunk to the surface fewer air molecules than normal are found above 5600 meter and thus the 500 mb surface is found at a lower elevation. If there are more molecules above 5600 meter in the warm region, then high pressure is located at 5600 meters. If fewer air molecules are above 5600 meters in the cold region, then low pressure is located at 5600 meters.