
1.7: Review and Additional Resources
- Page ID
- 15347

Review
Use the excersizes below to review and assess your learning. Start with the "Important Terms and Concepts" to ensure you know the terminology related to the topic of the chapter and concepts discussed. Move on to the "Review Questions" to answer critical thinking questions about concepts and processes discussed in the chapter. Finally, test your overall understanding by taking the "Self-assessment quiz".
-
- Geography
- the study of the distributions and interrelationships of earth phenomena
-
- Spatial science
- how geographers describe their discipline. Geographers are concerned with answering questions about how and why phenomena vary across the surface of the Earth
-
- Location
- "the position in space" of something
-
- Place
- “... the human and natural phenomena that give a location its unique character ...” (Gershmel, 2009)
-
- Spatial Pattern
- the arrangement or patterns of earth phenomena
-
- Spatial Interaction
- how elements of the earth system interact with one another to create geographic patterns
-
- Human Geography
- spatial aspects of human activities and culture
-
- Physical Geography
- the geographical attributes of the natural environment
-
- Continuum of Geography
- illustrated by diagram:
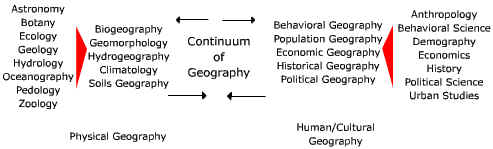
The Continuum of Geography
-
- Hypothesis
- an educated guess
-
- Theory
- a hypothesis or group of hypotheses that has been validated through repeated experiments and coming to the same conclusion
-
- Maps
- the fundamental tool of the geographer. With a map, one can illustrate the spatial distribution of almost any kind of phenomena.
-
- Spatial data
- the information collected to create a map
-
- Qualitative map data
- in the form of a quality and expresses the presence or absence of the subject on a map, like the kind of vegetation present occupying a region
-
- Quantitative map data
- expressed as a numerical value, like elevation in meters, or temperature is degrees celsius
-
- Choropleth map
- uses color to show variations in quantity, density, percent, etc. within a defined geographic area
-
- Dasymetric map
- employs special statistical methods and extra information to combine areas of similar values to depict geographic patterns on the map
-
- Isarithmic map
- uses isolines, lines that connect equal values, to illustrate continuous data such as elevation, air pressure, and precipitation
-
- Topographic Map
- use contour lines to show elevation
-
- index contour
- The heavy brown contour lines with the elevation printed on them
-
- Intermediate contour
- the lighter brown lines between index contours
-
- supplemental contour
- used in areas of very low relief
-
- Benchmark
- locations where the elevation has been surveyed. Benchmarks are denoted on a map with the letters "BM", "X" or a triangle with the elevation printed beside
-
- graduated circle map
- a way of depicting geographic information on a map
-
- Dot map
- use dots to illustrate the presence of the phenomenon on a map
-
- Isoline
- a line that connects points of equal value
-
- Contour line
- on topographic map, connect points of equal elevation
-
- Isobar
- used to show the distribution of air pressure
-
- gradient
- the change that occurs over a given distance
-
- Reference Map
- Reference or navigational maps are created to help you navigate over the earth surface
-
- Thematic Map
- used to communicate geographic concepts like the distribution of densities, spatial relationships, magnitudes, movements etc.
-
- Map Projection
- a method of portraying the curved surface of the Earth on a flat planar surface of a map
-
- Map Scale
- the relationship between distance on a map and distance in the real world
-
- Large scale map
- show a smaller area in great detail
-
- Small scale map
- have the least detail but show large areas
-
- Air Photograph
- provide us with a real world view of the earth’s surface
-
- Remote Sensing
- used via satellites to get a much larger view of the earth’s surface features. As the satellite scans the ground, it transmits this information to earth-based receivers.
-
- Geographic Information System
- a computer-based technology that enters, analyzes, manipulates, and displays geographic information.
-
- Models
- a representation of a real thing
-
- Statistic
- a quantity that is computed from a sample of data.
-
- Graph
- a visual way to portray the relationship between a set of variables.
-
- Global Positioning System
- consists of three parts: 1) Earth orbiting satellites, 2) control and monitoring stations across the Earth, and 3) GPS receivers owned by individuals.
-
- Latitude and Longitude
- Latitude and longitude comprises a grid system of lines encircling the globe and is used to determine the locations of points on the earth
-
- Prime meridian
- 0o longitude
-
- Great Circle
- If you pass a plane through the center of a sphere, the intersection of the plane and the surface of the sphere creates this
-
- Small Circle
- Created by planes passing through any part of a sphere without going through the center.
-
- Universal Transverse Mercator Grid (UTM)
- a plane coordinate grid system named for the map projection on which it is based
-
- Geographical Zones
- Geographers continue to use latitudinal variation of climate characteristics as a way of dividing the Earth into fairly homogeneous geographical zones.
-
- Greenwich mean time (GMT)
- the global standard for reporting time. It uses the 24-hour time (military) notation based on the local standard time at the prime meridian of 0o longitude. Midnight corresponds to 00:00 UTC and noon to 12:00 UTC
-
- Universal Coordinated Time (UTC)
- GMT is now referred to as Universal Time Coordinated (UTC) or Coordinated Universal Time but the prime meridian is still the reference for standard time.
-
- International Date Line
- an imaginary line the separates one day from another
-
- Daylight saving time
- the practice of setting clocks forward one hour in the spring and back one hour in the fall
Define what geography is and explain how the study of geography differs from other physical and social sciences.
- Answer
-
Geography is the study of the distributions and interrelationships of earth phenomena. Geography is described as a spatial science. Geographers integrate information about human and natural processes to explain the pattern and relationships of earth phenomena. It is this spatial approach that distinguishes geography from other disciplines.
What is the significance of the "geographic continuum".
- Answer
-
The geographic continuum represents the continuum of study within geography. Though geography can be broadly separated into human and physical geography, geography is actually a continuum as human activities and the natural environment cannot be separated from one another. As one approaches the center of the continuum, we see the intermingling of human and physical geography as environmental science.
Describe the steps of geographic inquiry.
- Answer
-
- Observation - data collection.
- Analysis - statistical manipulation of data; mapping; graphing; modeling.
- Explanation - Using knowledge of process to explain the analysis of observed phenomena.
- Prediction - Forecasting possible future scenarios
What is the difference between a large and small scale map?
- Answer
-
A large scale map, like 1:24000, covers a small area but show more detail than a small scale map. A small scale map, like 1:62500, shows a larger area, but little detail can be portrayed.
What is a model in geography? Give an example.
- Answer
-
A model is a representation of something. For instance, a globe is a model of the Earth. Models may be mathematical statements that represent climate processes.
Describe how graphs are used in geographic research.
- Answer
-
Graphs are used to show the relationships between earth phenomena. They can illustrate changes between earth processes and properties over distance and time.
What are descriptive statistics?
- Answer
-
Descriptive statistics like the mean, median, and mode characterize the nature of a set of data as a single number.
What is a geographic information system? Suggest how a GIS can be used to address geographic problems.
- Answer
-
A geographic information system is a method where by "layers" of geographic data are overlaid to show the spatial correlation of earth processes and properties. Soil, topography, and vegetation data layers could be overlaid to assess erosion potential.
Compare and contrast air photos and satellite imagery as tools of the geographer.
- Answer
-
Air photos give us a real world view of the earth’s surface, unlike a map which is a representation of the real world. Aerial photographs can be used to make the same measurements that we make on a map, as they too are a scaled image of the surface. Satellite imagery due to the location of the sensor, can give us a larger view of the earth. A variety of satellite imagery display techniques exist, like simulated natural color, or "false" color, each being useful in their own way for studying earth surface processes and properties. High-resolution imagery is also useful in detailed, close-up viewing.
Describe how latitude and longitude are measured on a globe.
- Answer
-
Latitude is measured in angular degrees north or south of the equator. Lines of latitude are called "parallels" as they parallel each other from the equator (0o latitude) to the pole (90o latitude. Lines of longitude are measured in angular degrees east or west of the prime meridian (0o latitude). Lines of longitude, or "meridians", are furthest apart at the equator and converge at the poles.
- A small scale map
- might have a representative fraction of 1:24000
- shows a small portion of the earth's surface
- makes features look large
- none of the above
- Live vegetation appears _____ on a false-color infra-red image.
- red
- green
- black
- blue
- Which of the following incorporates the smallest land area?
- A township
- A range
- A section
- All are equal area
- If you were half way between the equator and the north pole and one quarter of the way around the earth west of the prime meridian you will be at:
- 45 N; 90 W
- 45 N; 180 W
- 45 N; 90 E
- 45 N; 180 E
- Which of the following is not a model?
- a globe
- a physical equation
- a weather forecasting program
- all the above are models
- Which of the following tells us more about the temperature extremes of a climate?
- the average annual temperature
- the range of annual temperature
- a correlation statistic
- they all will give us the same information
- Which of the following types of maps is used to show the distribution of world soils?
- a topographic map
- a relief map
- a thematic map
- any of the above
- Lines of latitude
- converge at the poles
- are measured north or south of the prime meridian
- are parallel to each other
- all the above
- Lines connecting points of equal elevation are called
- topographic lines
- elevation lines
- isobars
- contour lines
- You measured 5.5 inches between two points on a 1:24000 scale map. The actual distance in miles is:
- 25
- 2.08
- 240
- 1100
- Answer
-
- D
- A
- C
- A
- D
- B
- C
- C
- D
- B
Additional Readings and Resources
Use these links to further explore the world of geography.
Interactivities
Contour drawing - practice drawing contour line from VisualEntities
Contour Analysis - practice drawing isotherms (from WeatherWise)
Studying Oceans from Space (NASA)
Multimedia
USGS Public Lecture Series: "Science Through Imagery" (April, 2009) Description from the site: "Knee-high to Bird's Eye: Multi-scale Remote Sensing of Vegetation Dynamics. Dr. John Jones, an expert in remote sensing, discusses several projects in the Shenandoah National Park and the Everglades. Learn how science from satellites can help decision-makers address issues related to climate change, water resources, and habitat conditions."
"Careers in Geoscience" - (AGI) from the Site "The Careers for Geoscientists video introduces the breadth of scope of the geosciences, including atmosphere, oceans, and the solid-Earth. Through interviews with individual practicing geoscientists discussing current projects, the nature of a career working in the geosciences is revealed. A discussion of the opportunities and adventures of travel, working outdoors, and using state-of-the-art technology is presented through this rare glimpse into the work-a-day world of geoscientists."
"Using Space Technology to Understand Earthquakes" (NASA JPL Lecture series)
"Laser Mapping Technology Gives New Glimpse of Earth" (NPR) Dec. 28, 2004 All Things Considered report on airborne LIDAR.
"Mapping Technology Helps Direct Tsunami Aid Efforts" (NPR) Dec. 29, 2004 All Things Considered report on LandScan mapping technology.
"Mapping Shuttle Debris" (NPR) Feb. 11, 2003 Morning Edition report on the use of GPS to map the debris field of the space shuttle Columbia.
"One Earth, Many Scales: Lost in Space? Geography Training for Astronauts" The Power of Place (Annenberg Media) Preparation for a NASA Shuttle mission provides context for introducing key issues in physical geography and human-environmental interaction. (First segment of program - 11:50) (Windows Media Player required) Go to the Power of Place site and scroll to "One Earth, Many Scales: Lost in Space? Geography Training for Astronauts"
Visualization
Google Earth - 3-D interface to the Earth
Web Sites
Association of American Geographers
National Council for Geographic Education
Virtual Geography Department Project