
1.2: Assignment- Topographic Maps
- Page ID
- 6073
\( \newcommand{\vecs}[1]{\overset { \scriptstyle \rightharpoonup} {\mathbf{#1}} } \) \( \newcommand{\vecd}[1]{\overset{-\!-\!\rightharpoonup}{\vphantom{a}\smash {#1}}} \)\(\newcommand{\id}{\mathrm{id}}\) \( \newcommand{\Span}{\mathrm{span}}\) \( \newcommand{\kernel}{\mathrm{null}\,}\) \( \newcommand{\range}{\mathrm{range}\,}\) \( \newcommand{\RealPart}{\mathrm{Re}}\) \( \newcommand{\ImaginaryPart}{\mathrm{Im}}\) \( \newcommand{\Argument}{\mathrm{Arg}}\) \( \newcommand{\norm}[1]{\| #1 \|}\) \( \newcommand{\inner}[2]{\langle #1, #2 \rangle}\) \( \newcommand{\Span}{\mathrm{span}}\) \(\newcommand{\id}{\mathrm{id}}\) \( \newcommand{\Span}{\mathrm{span}}\) \( \newcommand{\kernel}{\mathrm{null}\,}\) \( \newcommand{\range}{\mathrm{range}\,}\) \( \newcommand{\RealPart}{\mathrm{Re}}\) \( \newcommand{\ImaginaryPart}{\mathrm{Im}}\) \( \newcommand{\Argument}{\mathrm{Arg}}\) \( \newcommand{\norm}[1]{\| #1 \|}\) \( \newcommand{\inner}[2]{\langle #1, #2 \rangle}\) \( \newcommand{\Span}{\mathrm{span}}\)\(\newcommand{\AA}{\unicode[.8,0]{x212B}}\)
Module 1 Assignment
Topographic Maps

Instructions
NOTE: For all of the following figures, assume North is up.
- (2 pts) The following topographic map is from a coastal area and features an interesting geological hazard in addition to the ocean. Using a contour interval of 40 meters, label the elevation of every contour line on Map 1 below. (Note: elevation is meters above sea level, which makes sea level = ___m)
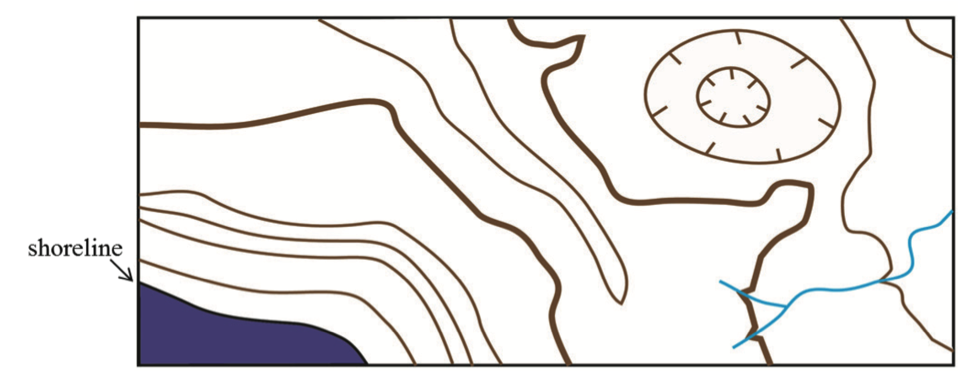 Map 1.
 - (4 pts) Imagine you are a geologist for the United States Geological Survey. You are tasked with creating your own coastal topographic map, so you hike around the area with a GPS receiver (Global Positioning System) and every so often you record your position along with the elevation in meters at that point, which results in Map 2 below. Complete this map by adding in the contour lines using a contour interval of 100 meters. Draw the contour lines so that they are continuous (do not die off ), and either continue off the map or form an enclosed circle (look at the topographic map in Question 1 for an example). More often than not, your contour lines will fall between the GPS points on your map, so do your best to determine the contour line positions.
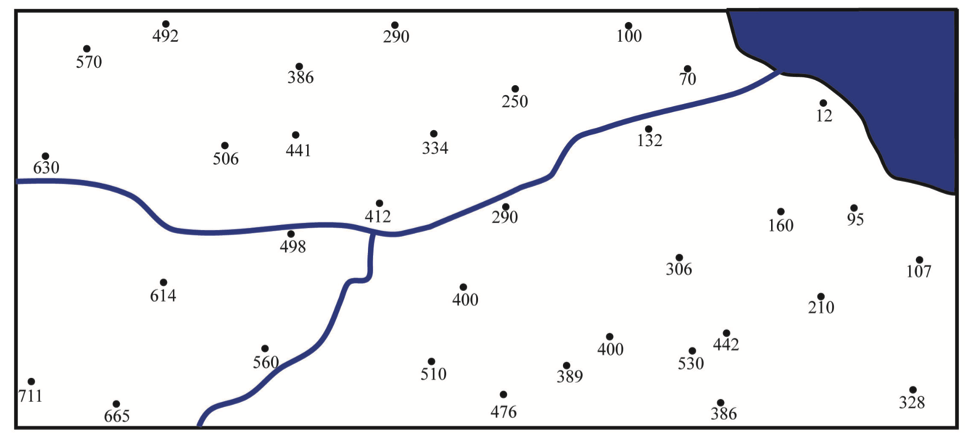 Map 2.
 - (1 pt) What is the contour interval on Map 3 above?
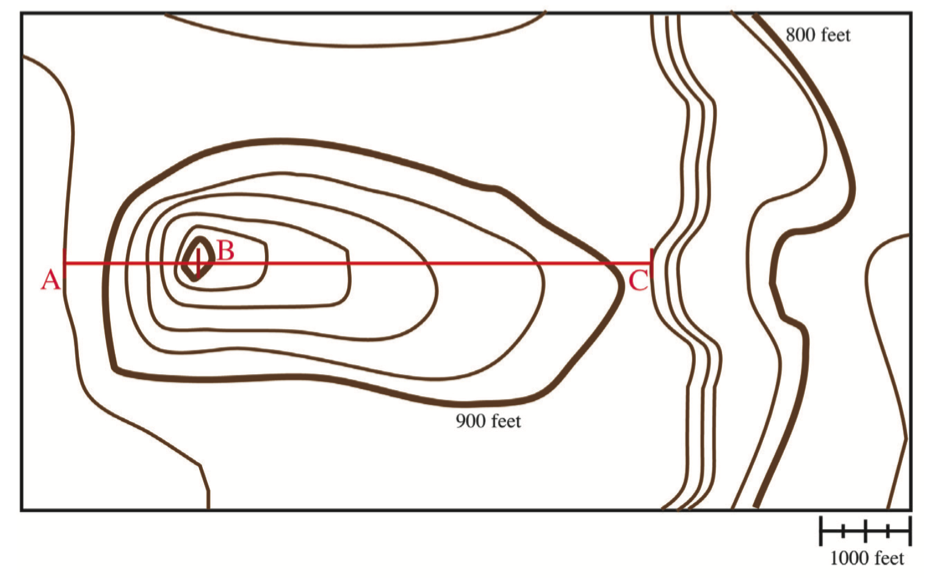 Map 3.
 - (1 pt) What is the regional relief on Map 3 above?
- (1 pt) Using the contour lines on Map 3, which area along the red line is steeper— A to B or B to C? Explain how you came to this conclusion.
- (2 pts) What is the gradient from A to B and B to C on Map 3? Show your work.
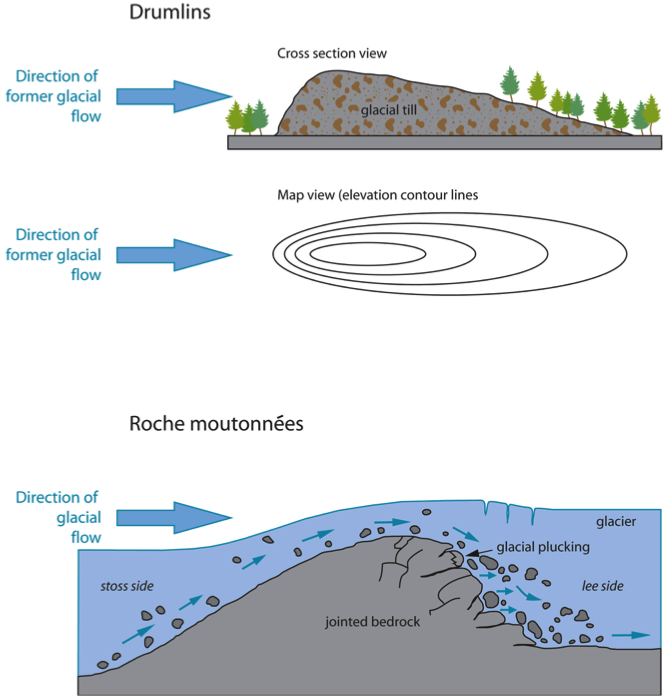
- (2 pts) Drumlins can be used to determine the original direction of flow in a glacier, with the glacier originally moving toward the shallower side of the structure and then retreating in the opposite direction (see illustration below).Using your previous answers from Questions 5 and 6 above and the illustration below, what direction was the glacier traveling originally traveling, before it retreated?Explain your answer. (Remember that North is up on the map.)
 Map 4.
 - (4 pts) Construct a topographic profile from A to A’ on the graph paper below.
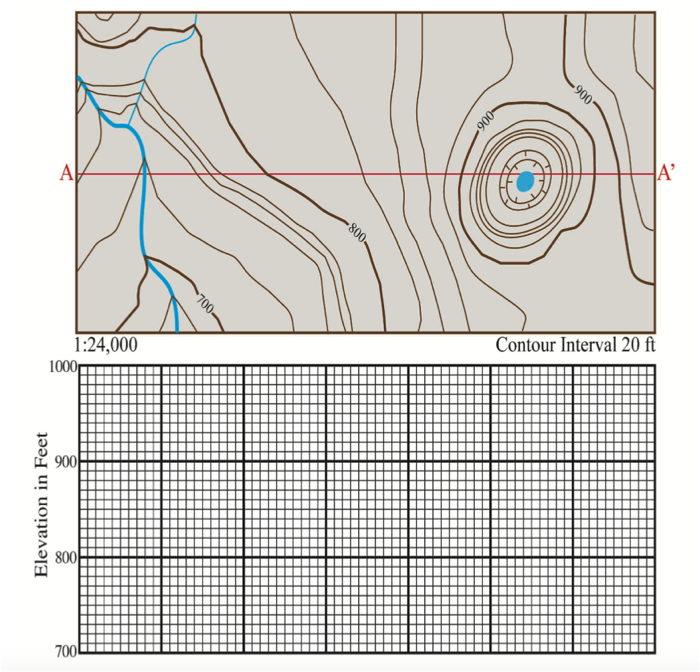 Map 5
Map 5 - (3 pts) Based on the scale you choose for the topography (vertical axis) in question 8, calculate the amount of vertical exaggeration on the topographic profile you constructed above. Show your work.