
4: TIGER, Topology and Geocoding
- Page ID
- 8170

TIGER, Topology and Geocoding
David DiBiase
4.1. Overview
In the Chapter 3 we studied the population data produced by the U.S. Census Bureau, and some of the ways those data can be visualized with thematic maps.
In addition to producing data about the U.S. population and economy, the Census Bureau is a leading producer of digital map data. The Census Bureau’s Geography Division created its “Topologically Integrated Geographic Encoding and Referencing” (TIGER) spatial database with help from the U.S. Geological Survey. In preparation for the 2010 census, the Bureau conducted a database redesign project that combined TIGER with a Master Address File (MAF) database. MAF/TIGER enables the Bureau to associate census data, which it collects by household address, with the right census areas and voting districts. This is an example of a process called address-matching or geocoding.
The MAF/TIGER database embodies the vector approach to spatial representation. It uses point, line, and polygon features to represent streets, water bodies, railroads, administrative boundaries, and select landmarks. In addition to the “absolute” locations of these features, which are encoded with latitude and longitude coordinates, MAF/TIGER encodes their “relative” locations–a property called topology.
MAF/TIGER also includes attributes of these vector features including names, administrative codes, and, for many streets, address ranges and ZIP Codes. Vector feature sets are extracted from the MAF/TIGER database to produce reference maps for census takers and thematic maps for census data users. Such extracts are called TIGER/Line Shapefiles.
Characteristics of TIGER/Line Shapefiles that make them useful to the Census Bureau also make them valuable to other government agencies and businesses. Because they are not protected by copyright, TIGER/Line data have been widely adapted for many commercial uses. TIGER has been described as “the first truly useful nationwide general-purpose spatial data set” (Cooke 1997, p. 47). Some say that it jump-started a now-thriving geospatial data industry in the U.S.
Objectives
The objective of this chapter is to familiarize you with MAF/TIGER and two important concepts it exemplifies: topology and geocoding. Specifically, students who successfully complete Chapter 4 should be able to:
- Explain how geographic entities are represented within MAF/TIGER;
- Explain how geometric primitives in MAF/TIGER are represented in TIGER/Line Shapefile extracts;
- Define topology and explain why and how it is encoded in TIGER;
- Perform address geocoding; and
- Describe how TIGER/Line files and similar products can be used for other applications, including routing and allocation.
Comments and Questions
Registered students are welcome to post comments, questions, and replies to questions about the text. Particularly welcome are anecdotes that relate the chapter text to your personal or professional experience. In addition, there are discussion forums available in the ANGEL course management system for comments and questions about topics that you may not wish to share with the whole world.
To post a comment, scroll down to the text box under “Post new comment” and begin typing in the text box, or you can choose to reply to an existing thread. When you are finished typing, click on either the “Preview” or “Save” button (Save will actually submit your comment). Once your comment is posted, you will be able to edit or delete it as needed. In addition, you will be able to reply to other posts at any time.
Note: the first few words of each comment become its “title” in the thread.
Concept Map
You may be interested in seeing the concept map used to guide development of Chapters 3 and 4.
4.2. Checklist
The following checklist is for Penn State students who are registered for classes in which this text, and associated quizzes and projects in the ANGEL course management system, have been assigned. You may find it useful to print this page out first so that you can follow along with the directions.
| Step | Activity | Access/Directions |
|---|---|---|
| 1 | Read Chapter 4 | This is the second page of the Chapter. Click on the links at the bottom of the page to continue or to return to the previous page, or to go to the top of the chapter. You can also navigate the text via the links in the GEOG 482 menu on the left. |
| 2 | Submit four practice quizzesincluding:
Practice quizzes are not graded and may be submitted more than once. | Go to ANGEL > [your course section] > Lessons tab > Chapter 4 folder > [quiz] |
| 3 | Perform “Try this” activitiesincluding:
“Try this” activities are not graded. | Instructions are provided for each activity. |
| 4 | Submit theChapter 4 Graded Quiz | ANGEL > [your course section] > Lessons tab > Chapter 4 folder > Chapter 4 Graded Quiz. See the Calendar tab in ANGEL for due dates. |
| 5 | Readcomments and questionsposted by fellow students. Add comments and questions of your own, if any. | Comments and questions may be posted on any page of the text, or in a Chapter-specific discussion forum in ANGEL. |
4.3. MAF/TIGER
MAF/TIGER is the Census Bureau’s geographic database system. Several factors prompted the U.S. Census Bureau to create MAF/TIGER: the need to conduct the census by mail, the need to produce wayfinding aids for census field workers, and its mission to produce map and data products for census data users.
CONDUCTING THE CENSUS BY MAIL
As the population of the U.S. increased it became impractical to have census takers visit every household in person. Since 1970, the Census Bureau has mailed questionnaires to most households with instructions that completed forms should be returned by mail. Most but certainly not all of these questionnaires are dutifully mailed—about 72 percent of all questionnaires in 2010. At that rate the Census Bureau estimates that some $1.6 billion was saved by reducing the need for field workers to visit non-responding households.

2010 Census questionnaire. For a question-by-question tour, go here.
To manage its mail delivery and return operations, the Census Bureau relies upon a Master Address File (MAF). MAF is a complete inventory of housing units and many business locations in the U.S., Puerto Rico, and associated island areas. MAF was originally built from the U.S. Postal Service’s Delivery Sequence File of all residential addresses. The MAF is updated through both corrections from field operations and a Local Update of Census Address (LUCA) program by which tribal, state, and local government liaisons review and suggest updates to local address records. “MAF/TIGER” refers to the coupling of the Master Address File with the TIGER spatial database, which together enable the Census Bureau to efficiently associate address-referenced census and survey data received by mail with geographic locations on the ground and tabulation areas of concern to Congress and many governmental agencies and businesses.
It’s not as simple as it sounds. Postal addresses do not specify geographic locations precisely enough to fulfill the Census Bureau’s constitutional mandate. An address is not a position in a grid coordinate system–it is only one in a series of ill-defined positions along a route. The location of an address is often ambiguous because street names are not unique, numbering schemes are inconsistent, and because routes have two sides, left and right. Location matters, as you recall, because census data must be accurately georeferenced to be useful for reapportionment, redistricting, and allocation of federal funds. Thus the Census Bureau had to find a way to assign address referenced data automatically to particular census blocks, block groups, tracts, voting districts, and so on. That’s what the “Geographic Encoding and Referencing” in the TIGER acronym refers to.
MAPS FOR CENSUS FIELD WORKERS
A second motivation that led to MAF/TIGER was the need to help census takers find their way around. Millions of households fail to return questionnaires by mail, after all. Census takers (called “enumerators” at the Bureau) visit non-responding households in person. Census enumerators need maps showing streets and select landmarks to help locate households. Census supervisors need maps to assign census takers to particular territories. Field notes collected by field workers are an important source of updates and corrections to the MAF/TIGER database.
Prior to 1990, the Bureau relied on local sources for its maps. For example, 137 maps of different scales, quality, and age were used to cover the 30-square-mile St. Louis area during the 1960 census. The need for maps of consistent scale and quality forced the Bureau to become a map maker as well as a map user. Using the MAF/TIGER system, Census Bureau geographers created over 17 million maps for a variety of purposes in preparation for the 2010 Census.
DATA PRODUCTS
The Census Bureau’s mission is not only to collect data, but also to make data products available to its constituents. In addition to the attribute data considered in Chapter 3, the Bureau disseminates a variety of geographic data products, including wall maps, atlases, and one of the earliest on-line mapping services, the TIGER Mapping Service. You can explore theBureau’s maps and cartographic data products here.
Launched in 1995, the TIGER Mapping Service was one of the earliest Internet map services. Registered students will use its successor, American Factfinder, in Project 2.
MAF/TIGER DATABASE REDESIGN
The Census Bureau conducted a major redesign of the MAF/TIGER database in the years leading up to the 2010 decennial census. What were separate, homegrown database systems (MAF and TIGER) are now unified in the industry-standard Oracle relational database management system. Benefits of this “commercial off-the-shelf” (COTS) database software include concurrent multi-user access, greater user familiarity, and better integration with Web development tools. As Galdi (2005) explains in his white paper “Spatial Data Storage and Topology in the Redesigned MAF/TIGER System,” the redesign “mirrors a common trend in the Information Technology (IT) and Geographic Information System (GIS) industries: the integration of spatial and non-spatial data into a single enterprise data set” (p. 2).
Concurrent with the MAF/TIGER redesign, the Census Bureau also updated the distribution format of its TIGER/Line map data extracts. Consistent with the Bureau’s COTS strategy, it adopted the defacto standard Esri “Shapefile” format. The following pages consider characteristics of the spatial data stored in MAF/TIGER and in TIGER/Line Shapefile extracts.
4.4. Vector Extracts from MAF/TIGER
The Census Bureau began to develop a digital geographic database of 144 metropolitan areas in the 1960s. By 1990, the early efforts had evolved into TIGER: a seamless digital geographic database that covered the whole of the United States and its territories. As discussed in the previous page, MAF/TIGER succeeded TIGER in the lead-up to the 2010 Census.
TIGER/Line Shapefiles are digital map data products extracted from the MAF/TIGER database. They are freely available from the Census Bureau, and are suitable for use by individuals, businesses and other agencies that don’t have direct access to MAF/TIGER.
This section outlines the geographic entities represented in the MAF/TIGER database, describes how a particular implementation of the vector data model is used to represent those entities, and considers the accuracy of digital features in relation to their counterparts on the ground. The following page considers characteristics of the “Shapefile” data format used to distribute digital extracts from MAF/TIGER.
GEOGRAPHIES REPRESENTED IN TIGER AND SHAPEFILE EXTRACTS
The MAF/TIGER database is selective. Only those geographic entities needed to fulfill the Census Bureau’s operational mission are included. Entities that don’t help the Census Bureau conduct its operations by mail, or help field workers navigate a neighborhood, are omitted. Terrain elevation data, for instance, are not included in MAF/TIGER. A comprehensive list of the “feature classes” and “superclasses” included in MAF/TIGER and Shapefiles can be found in Appendix F of theTIGER/Line Shapefiles Technical Documentation. Examples of superclasses include:
- Potential living quarters (e.g., sites of shelters, retirement homes, prisons, dormitories)
- Road/path features (e.g., primary roads, secondary roads, local neighborhood roads)
- Hydrographic features (e.g., stream/river, lake/pond, ocean/sea)
- Miscellaneous linear features (e.g., pipeline, powerline, fence line)
- Tabulation areas (e.g., county or equivalent, tract, block group, block
| MTFCC | FEATURE CLASS | SUPERCLASS | POINT | LINEAR | AREAL | FEATURE CLASS DESCRIPTION |
|---|---|---|---|---|---|---|
| $1400 | Local Neighborhood Road, Rural Road, City Street | Road/Path Features | N | Y | N | Generally a paved non-arterial street, road, or byway that usually has a single lane of traffic in each direction. Roads in this feature class may be privately or publicly maintained. Scenic park roads would be included in this feature class, as would (depending on the region of the country) some unpaved roads. |
| $1500 | Vehicular Trail (4WD) | Road/Path Features | N | Y | N | An unpaved dirt trail where a four-wheel drive vehicle is required. These vehicular trails are found almost exclusively in very rural areas. Minor, unpaved roads usable by ordinary cars and trucks belong in the $1400 category. |
| $1630 | Ramp | Road/Path Features | N | Y | N | A road that allows controlled access from adjacent roads onto a limited access highway, often in the form of a cloverleaf interchange. These roads are unaddressable. |
Excerpt from TIGER/Line Technical Documentation (Census Bureau 2012) showing some of the feature classes included in the “Road/Path Features” superclass.
Note also that neither the MAF/TIGER database nor TIGER/Line Shapefiles include the population data collected through questionnaires and by census takers. MAF/TIGER merely provides the geographic framework within which address-referenced census data are tabulated.
TRY THIS!
EXPLORING AVAILABLE TIGER/LINE SHAPEFILES
In this Try This (One of 3 dealing with TIGER/Line Shapefiles) you are going to explore which TIGER/Line Shapefiles are available for download at various geographies and what information those files contain. We will be exploring the 2009 and 2010 versions of the TIGER/Line Shapefile data sets. Versions from other years are available. Feel free to investigate those, too.
- Follow this link to get to the TIGER Products page of the Census Bureau web site, then follow the TIGER/Line Shapefiles link found under Which product should I use? to get to the Geography page.
- Link to the 2010 TIGER/Line Shapefiles via the 2010 tab link.
- Select Download, and then from the expanded list choose Web Interface.
- Expand the pick list under Select a layer type. Spend some time choosing different entries from the layer pick list and then using theSubmit button to navigate through the sub layers taking note of when you are offered access to a Download button. Take note of a couple of things. (1) Some of the pick lists make a selection available that allows you to download a shapefile dataset for the entire country. (2) For some of the choices you must navigate to the County level before the Download button is available
As stated above we want you to get a sense of the sorts of data that are available for the various geographies — from the county to the national level. Perusing the various layers as I had you doing above makes it difficult to make an overall assessment of what data there is at a given geographic scale. Fortunately for our purposes the Census has provided a convenient table to help us in this regard.
- You should still be on the 2010 TIGER/Line Shapefiles | Select a layer type page.
Click on the Documentation link in the upper right portion of the page. This will take you back to the Geography page. - Select the 2010 tab again.
- Select File Availability.
Study the table that appears. - Note that there are columns titled State- and County-based Files,Nation-based Files, and American Indian Area-based Files.
- Compare which geographies (the Layer column) are available in theNation-Based Files category to those available in the State-Based Files category.
What files are available for a state that are not available for the whole nation? Can you think of reasons why these are not available as a single national file? Post a comment below to discuss with your fellow students. - Now, compare the State-Based Files category to the County-Based Files category. What files available at the state level are also available at the county-level? Once again, share your thoughts with your peers.
GEOMETRIC PRIMITIVES
Like other implementations of the vector data model, MAF/TIGER represents geographic entities using geometric primitives including nodes (point features), edges (linear features), and faces (area features). These are defined and illustrated below.
- Nodes (labeled “N” in the illustration below) are “0-dimensional,” consisting only of a single pair of latitude and longitude coordinates.
- Nodes N21-23 are isolated nodes. That is, they are not end points of edges.
- Edges (labeled “E” in the illustration below) are 1-dimensional linear primitives used to represent streets, railroads, pipelines, and rivers.
- The end points of an edge are called connecting nodes.
- Each edge is assigned a direction, denoted by the arrowheads. The directionality of the edge allows the designation of a Start Node and an End Node. The Start Node of edge E12 below is N9, and the End Node is N6.
- An edge may have intermediate points called vertices that define its shape.
- Faces (labeled “F” in the illustration below) are the 2-dimensional geometric primitives used to represent entities like blocks, counties, and voting districts. A face is a polygon bounded by edges.
- The directionality of an edge also allows left and right faces to be designated. Face F1 is on the left of edge E12 and face F2 is to the right.

Geometric primitives of the Topologically Integrated Geographic Encoding and Referencing (TIGER) database. The figure shows what might be two adjacent Census blocks, with the bottom block bounded on the south by a river. The remaining edges might correspond to streets, and the isolated nodes might be landmarks such as a school, a church and a zoo.
GEOMETRIC ACCURACY
Until recently the geometric accuracy of the vector features encoded in TIGER were notoriously poor (see illustration below). How poor?Through 2003, the TIGER/Line metadata stated that
TRY THIS!
Having performed scale calculations in Chapter 2 you should be able to calculate the magnitude of error (ground distance) associated with 1:100,000-scale topographic maps. Recall that the allowed error for USGS topographic maps at scales of 1:20,000 or smaller is 1/50 inch (see the nationalmap standards pdf)
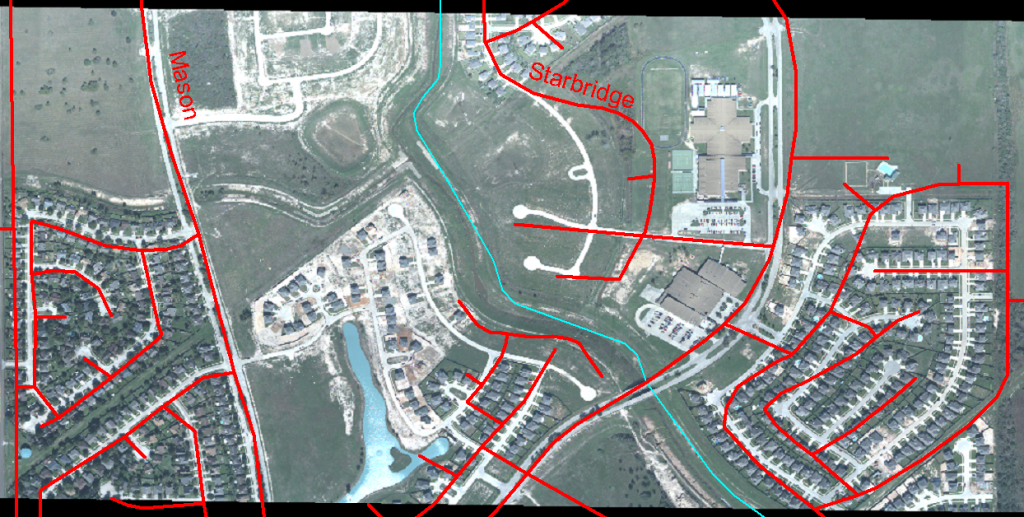
Discrepancy between pre-modernization TIGER/Line file streets (red) and actual geometry of street network shown in an orthorectified aerial image (U.S. Census Bureau n.d).
ACCURACY IMPROVEMENT
Starting in 2002, in preparation for the 2010 census, the Census Bureau commissioned a six-year, $200 million MAF/TIGER Accuracy Improvement Project (MTAIP). One objective of the effort was to use GPS to capture accurate geographic coordinates for every household in the MAF. Another objective was to improve the accuracy of TIGER’s road/path features. The project aimed to adjust the geometry of street networks to align within 7.6 meters of street intersections observed in orthoimages or measured using GPS. The corrected streets are necessary not just for mapping, but for accurate geocoding. Because streets often form the boundaries of census areas, it is essential that accurate household locations are associated with accurate street networks.
MTAIP integrated over 2,000 source files submitted by state, tribal, county, and local governments. Contractors used survey-grade GPS to evaluate the accuracy of a random sample of street centerline intersections of the integrated source files. The evaluation confirmed that most but not all features in the spatial database equal or exceed the 7.6 meter target. Uniform accuracy wasn’t possible due to the diversity of local source materials used, though this accuracy is the standard in the “All Lines” Shapefile extracts. The geometric accuracy of particular feature classes included in particular shapefiles are documented in the metadata associated with that shapefile extract.
MTAIP was completed in 2008. In conjunction with the continuous American Community Survey and other census operations, corrections and updates are now ongoing. TIGER/Line Shapefile updates are now released annually.
PRACTICE QUIZ
Registered Penn State students should return now to the Chapter 4 folder in ANGEL (via the Resources menu to the left) to take a self-assessment quiz about MAF and TIGER.
You may take practice quizzes as many times as you wish. They are not scored and do not affect your grade in any way.
4.5. Shapefiles
Since 2007, TIGER/Line extracts from the MAF/TIGER database have been distributed in shapefile format. Esri introduced shapefiles in the early 1990s as the native digital vector data format of its ArcView software product. The shapefile format is proprietary, but open; its technical specifications are published and can be implemented and used freely. Largely as a result of ArcView’s popularity, shapefile has become a de facto standard for creation and interchange of vector geospatial data. The Census Bureau’s adoption of Shapefile as a distribution format is therefore consistent with its overall strategy of conformance with mainstream information technology practices.
ELEMENTS OF A SHAPEFILE DATA SET
The first thing GIS pros need to know about shapefiles is that every shapefile data set includes a minimum of three files. One of the three required files stores the geometry of the digital features as sets of vector coordinates. A second required file holds an index that, much like the index in a book, allows quicker access to the spatial features and therefore speeds processing of a given operation involving a subset of features. The third required file stores attribute data in dBASE© format, one of the earliest and most widely-used digital database management system formats. All of the files that make up a Shapefile data set have the same root or prefix name, followed by a three-letter suffix or file extension. The list below shows the names of the three required files making up a shapefile data set named “counties.” Take note of the file extensions.
- counties.shp: The main shape file, containing vector coordinate data
- counties.shx: The index file
- counties.dbf: The dBASE table
Esri lists twelve additional optional files, and practitioners are able to include still others. Two of the most important optional files are the “.prj” file, which includes the coordinate system definition, and “.xml”, which stores metadata. (Why do you suppose that something as essential as a coordinate system definition is considered “optional”?)
TRY THIS!
DOWNLOADING AND VIEWING A TIGER/LINE SHAPEFILE
In this Try This! (the second of 3 dealing with TIGER/Line Shapefiles), you will download a TIGER/Line Shapefile dataset, investigate the file structure of a typical Esri shapefile, and view it in GIS software.
You can use a free software application called Global Mapper (originally known as dlgv32 Pro) to investigate TIGER/Line shapefiles. Originally developed by the staff of the USGS Mapping Division at Rolla, Missouri as a data viewer for USGS data, Global Mapper has since been commercialized, but is available in a free trial version. The instructions below will guide you through the process of installing the software and opening the TIGER/Line data.
- Downloading TIGER/Line Shapefiles: You are going to use the 2010 TIGER/Line Shapefiles.
- Return to the 2010 TIGER/Line Shapefiles download page.
- From the Select a layer type pick list, under Features, choose All Lines and click submit. (You are welcome to download and investigate any TIGER/Line Shapefile(s), but we will use an All Linesdataset in the geocoding Try This later in the chapter, so your downloading one here will make you more familiar with the content.)
- From the All Lines pick list select a state or territory and clickSubmit.
- Select a County from the next pick list that appears and clickDownload.
- Save the file to your computer.
The file you download should have a name liketl_2010_42027_edges.zip. The root name of this file,tl_2010_42027_edges in this example, will also be the name of the shapefile dataset. The 42027 is a federal code that represents Pennsylvania (state 42) and Centre County (county 027). The five-digit code in your file name will depend on which state and county you selected. - The data are compressed in a .zip archive. Extract the data to a new named folder in a known location. (Within the file hierarchy that is extracted there may be a second .zip file that needs to be uncompressed.)
-
Investigating the shapefile data set:
- Navigate to within the folder in which you stored your uncompressed TIGER/Line Shapefile dataset.
- Notice the multiple files which make up the shapefile dataset, including:
- tl_2010_42027_edges.shp, containing the vector coordinate data
- tl_2010_42027_edges.shp.xml, containing metadata
- tl_2010_42027_edges.shx, the index file
- tl_2010_42027_edges.dbf, the dBASE file
- tl_2010_42027_edges.prj, containing the projection/spatial reference
- All of the files work in concert to store the necessary components of the Esri shapefile data set. You may be familiar with some of the individual files types. The contents of three of them can be easily viewed. Let’s open those three. You can double click on the file and then select “from a list of installed programs,” or you may need to run the suggested application and open the file from within it. Let me know if you need help, or help each other in the ANGEL Chapter 4 Discussion Forum or in the Comments area below.
- Open the .dbf file using Microsoft Excel.
Note the typical row-column structure of a flat-file database. Can you find the four columns, or fields, that hold the address range information? Look for LFROMADD, etc. The field name LFROMADD is shorthand for Left From Address. The 10-character length of the field name points up one of the constraints of the dBASE format–field names are limited to 10 characters. - Open the .xml file using your web browser.
You should see the metadata information bracketed by tagscontained within directional brackets < >. XML stands for Extensible Markup Language, and is a common set of rules for encoding documents. Can you locate the portion of the document having to do with horizontal spatial accuracy? (Spatial accuracy metadata is available when you’ve chosen the All Lines file as your candidate shapefile.) - Open the .prj file using Notepad, or any vanilla text editor.
There are five pieces of information in this file, separated by commas. What are they? They should reinforce some of what you learned in Chapter 2 regarding what defines a geographic coordinate system. - The .shp and .shx files are proprietary and specific to the functionality of the shapefile data set.
- Open the .dbf file using Microsoft Excel.
- Discuss what you find with your classmates in comments below.
- Note that one should not alter the contents of any of these files with any application other than a GIS program that is designed for that task.
-
Viewing the shapefile dataset in Global Mapper:
- Download and install the Global Mapper software:
- Navigate to the Blue Marble Global Mapper site.
- Download the trial version of the software
- Double-click on the setup file you downloaded to install the program
- Launch the Global Mapper program
- After opening the Global Mapper software, choose Open Data File(s)... under the File menu, or click the “Open Your Own Data Files” button in the center of the window. Navigate to the extracted shapefile dataset you downloaded above and open it. (Remember, your complete shapefile data set will have a name similar totl_2010_42027_edges. It will show up in the Open dialog with a .shp extension.)
- You should be able to see all of the line features (the edges, from the MAF/TIGER database) contained in your county. If you are using the newest version of Global Mapper you should be able to discern roads from rivers/streams from administrative boundaries, etc. In older versions of the application the default view showed all line features in a single color and line weight, so the user needed to use the symbolization tools to make the different classes of features distinguishable.
What do you think has to be understood by the mapping application to allow it to automatically symbolize features differently? Post your thoughts below.
- Download and install the Global Mapper software:
SHAPEFILE PRIMITIVES
A single shapefile data set can contain one of three types of spatial data primitives, or features – points, lines or polygons (areas). The technical specification defines these as follows:
- Points: A point consists of a pair of double-precision coordinates in the order X,Y.
- Lines: More specifically a polyline, is an ordered set of points, or vertices, that consists of one or more parts. A part is a connected sequence of two or more points. Parts may or may not be connected to one another. Parts may or may not intersect one another.
- Polygons: A polygon consists of one or more rings. A ring is a connected sequence of four or more points, or vertices, that form a closed, non-self-intersecting loop.
- Other: M (measured; route data) and Z (3D; vertical datum) versions of point, polyline and polygon Shapefile data sets can be created, but are not included in the TIGER/Line Shapefile extracts.
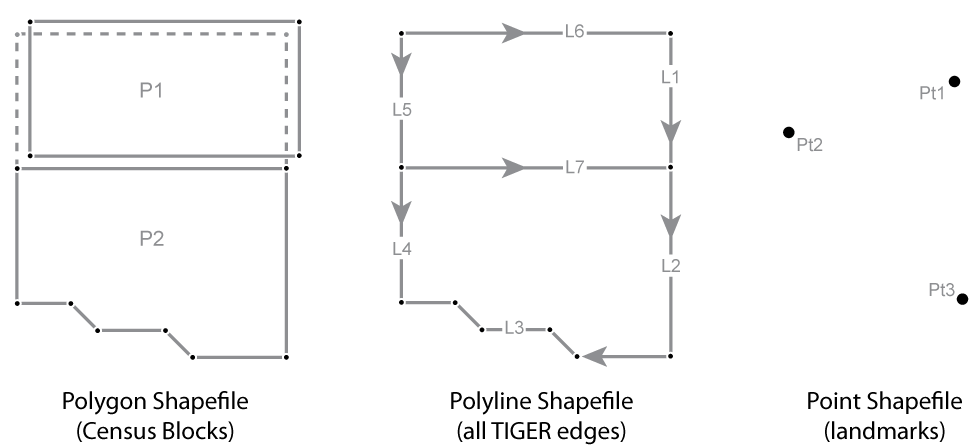
Three Shapefile data sets that could be extracted from the MAF/TIGER data depicted on the preceding page
At left in the illustration above, a polygon Shapefile data set holds the Census blocks in which the edges from the MAF/TIGER database have been combined to form two distinct polygons, P1 and P2. The diagram shows the two polygons separated to emphasize the fact that what is the single E12 edge in the MAF/TIGER database (see the diagram on page 4) is now present in each of the Census block polygon features.
In the middle of the illustration, a polyline Shapefile data set holds seven line features (L1-7) that correspond to the seven edges in the MAF/TIGER database. The directionality of the line features that represent streets corresponds to address range attributes in the associated dBASE© table. Vertices define the shape of a polygon or a line, and the Start and End Nodes from the MAF/TIGER database are now First and Last Vertices.
Finally, at right in the illustration above, a point Shapefile data set holds the three isolated nodes from the MAF/TIGER database.
PRACTICE QUIZ
Registered Penn State students should return now to the Chapter 4 folder in ANGEL (via the Resources menu to the left) to take a self-assessment quiz about Shapefiles.
You may take practice quizzes as many times as you wish. They are not scored and do not affect your grade in any way.
4.6. Topology
Topology is different than topography. (You’d be surprised how often these terms get mixed up.) In Chapter 2 you read about the various ways that absolute positions of features can be specified in a coordinate system, and how those coordinates can be projected or otherwise transformed. Topology refers to the relative positions of spatial features. Topological relations among features—such as containment, connectivity, and adjacency—don’t change when a dataset is transformed. For example, if an isolated node (representing a household) is located inside a face (representing a congressional district) in the MAF/TIGER database, you can count on it remaining inside that face no matter how you might project, rubber-sheet, or otherwise transform the data. Topology is vitally important to the Census Bureau, whose constitutional mandate is to accurately associate population counts and characteristics with political districts and other geographic areas.
As David Galdi (2005) explains in his white paper “Spatial Data Storage and Topology in the Redesigned MAF/TIGER System,” the “TI” in TIGER stands for “Topologically Integrated.” This means that the various features represented in the MAF/TIGER database—such as streets, waterways, boundaries, and landmarks (but not elevation!)—are not encoded on separate “layers.” Instead, features are made up of a small set of geometric primitives—including 0-dimensional nodes and vertices, 1-dimensional edges, and 2-dimensional faces—without redundancy. That means that where a waterway coincides with a boundary, for instance, MAF/TIGER represents them both with one set of edges, nodes and vertices. The attributes associated with the geometric primitives allow database operators to retrieve feature sets efficiently with simple spatial queries. The separate feature-specific TIGER/Line Shapefiles published at the county level (such as point landmarks, hydrography, Census block boundaries, and, the “All Lines” file you are using in the multi-part “Try This”) were extracted from the MAF/TIGER database in that way. Notice, however, that when you examine a hydrography shapefile and a boundary shapefile, you will see redundant line segments where the features coincide. That fact confirms that TIGER/Line Shapefiles, unlike the MAF/TIGER database itself, are not topologically integrated. Desktop computers are now powerful enough to calculate topology “on the fly”from shapefiles or other non-topological data sets. However, the large batch processes performed by the Census Bureau still benefit from the MAF/TIGER database’s persistent topology.
MAF/TIGER’s topological data structure also benefits the Census Bureau by allowing it to automate error-checking processes. By definition, features in the TIGER/Line files conform to a set of topological rules (Galdi 2005):
- Every edge must be bounded by two nodes (start and end nodes)..
- Every edge has a left and right face.
- Every face has a closed boundary consisting of an alternating sequence of nodes and edges.
- There is an alternating closed sequence of edges and faces around every node.
- Edges do not intersect each other, except at nodes.
Compliance with these topological rules is an aspect of data quality calledlogical consistency. In addition, the boundaries of geographic areas that are related hierarchically—such as blocks, block groups, tracts, and counties—are represented with common, non-redundant edges. Features that do not conform to the topological rules can be identified automatically, and corrected by the Census geographers who edit the database. Given that the MAF/TIGER database covers the entire U.S. and its territories, and includes many millions of primitives, the ability to identify errors in the database efficiently is crucial.
So how does topology help the Census Bureau assure the accuracy of population data needed for reapportionment and redistricting? To do so, the Bureau must aggregate counts and characteristics to various geographic areas, including blocks, tracts, and voting districts. This involves a process called “address matching” or “address geocoding” in which data collected by household is assigned a topologically-correct geographic location. The following pages explain how that works.
PRACTICE QUIZ
Registered Penn State students should return now to the Chapter 4 folder in ANGEL (via the Resources menu to the left) to take a self-assessment quiz about Topology.
You may take practice quizzes as many times as you wish. They are not scored and do not affect your grade in any way.
4.7. Geocoding
Geocoding is the process used to convert location codes, such as street addresses or postal codes, into geographic (or other) coordinates. The terms “address geocoding” and “address mapping” refer to the same process. Geocoding address-referenced population data is one of the Census Bureau’s key responsibilities. However, as you know, it’s also a very popular capability of online mapping and routing services. In addition, geocoding is an essential element of a suite of techniques that are becoming known as “business intelligence.” We’ll look at applications like these later in this chapter, but first let’s consider how the Census Bureau performs address geocoding.
ADDRESS GEOCODING AT THE U.S. CENSUS
Prior to the MAF/TIGER modernization project that led up to the decennial census of 2010, the TIGER database did not include a complete set of point locations for U.S. households. Lacking point locations, TIGER was designed to support address geocoding by approximation. As illustrated below, the pre-modernization TIGER database includedaddress range attributes for the edges that represent streets. Address range attributes were also included in the TIGER/Line files extracted from TIGER. Coupled with the Start and End nodes bounding each edge, address ranges enable users to estimate locations of household addresses.
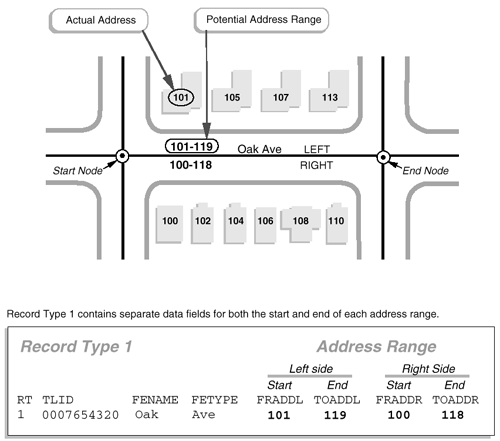
How address range attributes were encoded in TIGER/Line files (U.S. Census Bureau 1997). Address ranges in contemporary TIGER/Line Shapefiles are similar, except that “From” (FR) and “To” nodes are now called “Start” and “End”. Also, changes have been made to field (column) names in the attribute tables. Compare the names of the address range fields that you looked at in the second Try This exercise to those above.
Here’s how it works. The diagram above highlights an edge that represents a one-block segment of Oak Avenue. The edge is bounded by two nodes, labeled “Start” and “End.” A corresponding record in an attribute table includes the unique ID number (0007654320) that identifies the edge, along with starting and ending addresses for the left (FRADDL, TOADDL) and right (FRADDR, TOADDR) sides of Oak Avenue. Note also that the address ranges include potential addresses, not just existing ones. This is to make sure that the ranges will remain valid as new buildings are constructed along the street.
A common geocoding error occurs when Start and End designations are assigned to the wrong connecting nodes. You may have read in Galdi’s (2005) white paper “Spatial Data Storage and Topology in the Redesigned MAF/TIGER System,” that in MAF/TIGER, “an arbitrary direction is assigned to each edge, allowing designation of one of the nodes as the Start Node, and the other as the End Node” (p. 3). If an edge’s “direction” happens not to correspond with its associated address ranges, a household location may be placed on the wrong side of a street.
Although many local governments in the U.S. have developed their own GIS “land bases” with greater geometric accuracy than pre-modernization TIGER/Line files, similar address geocoding errors still occur. Kathryn Robertson, a GIS Technician with the City of Independence, Missouri (and a student in the Fall 2000 offering of this course) pointed out how important it is that Start (or “From”) nodes and End (or “To”) nodes correspond with the low and high addresses in address ranges. “I learned this the hard way,” she wrote, “geocoding all 5,768 segments for the city of Independence and getting some segments backward. When address matching was done, the locations were not correct. Therefore, I had to go back and look at the direction of my segments. I had a rule of thumb, all east-west streets were to start from west and go east; all north-south streets were to start from the south and go north” (personal communication).
Although this may have been a sensible strategy for the City of Independence, can you imagine a situation in which Kathryn’s rule-of-thumb might not work for another municipality? If so, and if you’re a registered student, please add a comment to this page.
AFTER MAF/TIGER MODERNIZATION
If TIGER had included accurate coordinate locations for every household, and correspondingly accurate streets and administrative boundaries, geocoding census data would be simple and less error-prone. Many local governments digitize locations of individual housing units when they build GIS land bases for property tax assessment, E-911 dispatch and other purposes. The MAF/TIGER modernization project begun in 2002 aimed to accomplish this for the entire nationwide TIGER database in time for the 2010 census. The illustration below shows the intended result of the modernization project, including properly aligned streets, shorelines, and individual household locations, shown here in relation to an orthorectified aerial image.
Intended accuracy and completeness of modernized TIGER data in relation to the real world. TIGER streets (yellow), shorelines (blue), and housing unit locations (red) are superimposed over an orthorectified aerial image. (U.S. Census Bureau n.d.). National coverage of housing unit locations and geometrically-accurate streets and other features were not available in 2000 or before.
The modernized MAF/TIGER database described by Galdi (2005) is now in use, including precise geographic locations of over 100 million household units. However, because household locations are considered confidential, users of TIGER/Line Shapefiles extracted from the MAF/TIGER database still must rely upon address geocoding using address ranges.
LEVERAGING TIGER/LINE DATA FOR PRIVATE ENTERPRISE
Launched in 1996, MapQuest was one of the earliest online mapping, geocoding and routing services. MapQuest combined the capabilities of two companies: a cartographic design firm with long experience in producing road atlases, “TripTiks” for the American Automobile Association, and other map products, and a start-up company that specialized in custom geocoding applications for business. Initially, MapQuest relied in part on TIGER/Line street data extracted from the pre-modernization TIGER database. MapQuest and other commercial firms were able to build their businesses on TIGER data because of the U.S. government’s wise decision not to restrict its reuse. It’s been said that this decision triggered the rapid growth of the U.S. geospatial industry.
Later on in this chapter we’ll visit MapQuest and some of its more recent competitors. Next, however, you’ll have a chance to see how geocoding is performed using a TIGER/Line data in a GIS.
4.8. Geocoding with TIGER/Line Shapefiles
TRY THIS!
GEOCODING IN A GIS
Part 3 of 3 in the TIGER/Line Shapefile Try This! series is not interactive but instead illustrates how the address ranges encoded in TIGER/Line Shapefiles can be used to pinpoint (more or less!) the geographic locations of street addresses in the U.S.
The process of geocoding a location within a GIS begins with a line dataset (shapefile) with the necessary address range attributes. The following image is an example of the attribute table of a TIGER/Line shapefile.
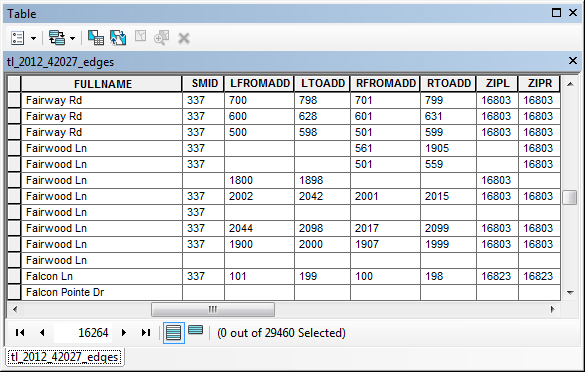
Visible in this image are just a few rows, which represent a handful of road segments and their corresponding address ranges. This shapefile contains over 29,000 road segments in total. Note the names of some of the attributes:
- FULLNAME – The street name of the road segment
- LFROMADD – The address number at the beginning of the road segment on the left side of the street
- LTOADD – The address number at the end of the road segment on the left side of the street
- RFROMADD – The address number at the beginning of the road segment on the right side of the street
- RTOADD – The address number at the end of the road segment on the right side of the street
- ZIPL – The zip code area that is present to the left side of the road segment
- ZIPR – The zip code area that is present to the right side of the street
Next, the GIS software needs to know which of these attributes contains each piece of the necessary address range information. Some shapefiles use different names for their attributes, so the GIS can’t always know which attribute contains the Right-Side-From-Address information, for example. In ArcGIS, for example, something called a Locator is configured that maps the attributes in the shapefile to the corresponding piece of necessary address information. The image below illustrates what this mapping looks like:
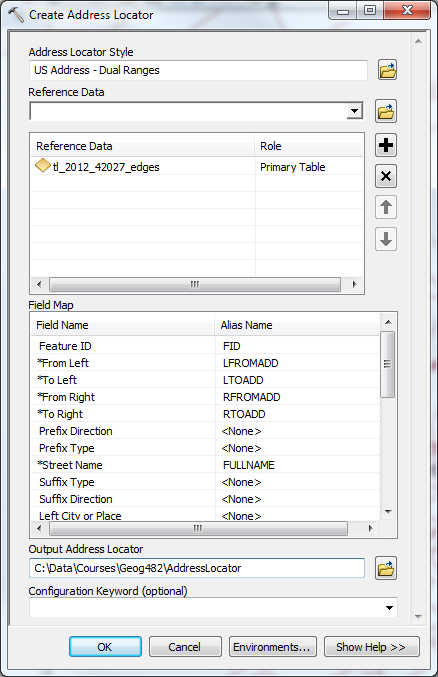
Note the items with an asterisk (*). These are the minimum required attributes that need to be present in the shapfile for the geocoding to work. The items in the “Alias Name” column correspond to attributes in the shapefile.
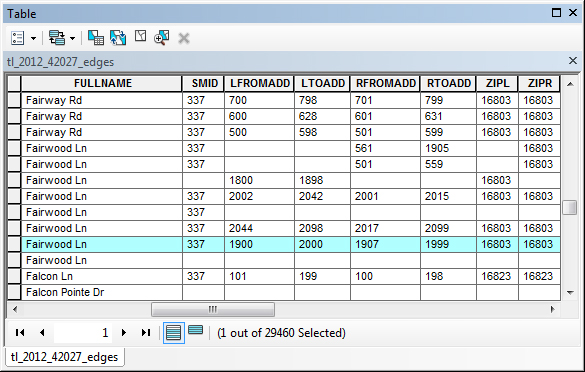
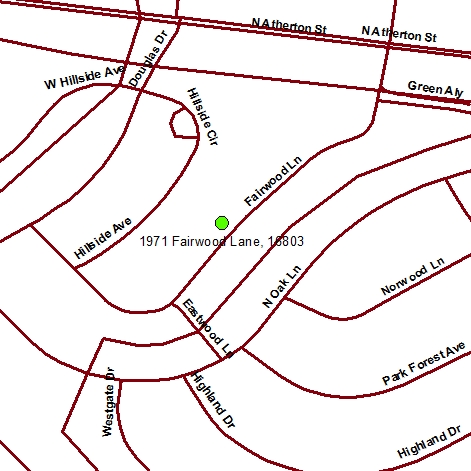
We are now ready to find a location by searching for a street address! Let’s geocode the location for “1971 Fairwood Lane, 16803″.
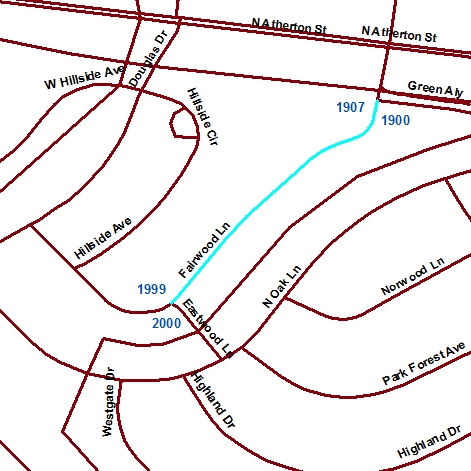
When an address is specified, the GIS queries the attribute table to find rows with a matching street name in the correct zipcode. Also, the particular segment of the street that contains the address number is identified. The below image shows the corresponding selection in the attribute table:
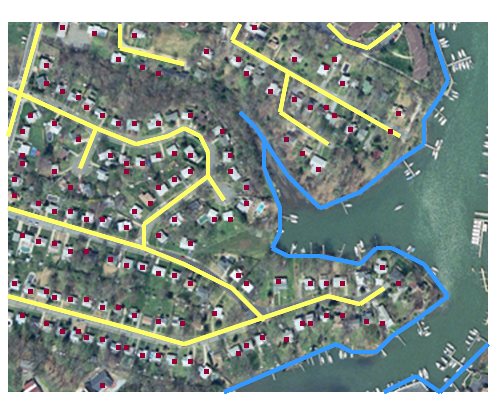
The image below shows the corresponding road segment highlighted on a map. The To and From address values for the road segment have been added so you can see the range of addresses.
Finally, the GIS interpolates where along the road segment the value of 1971 occurs and places it on the appropriate side of the street based on the even/odd values indicated in the attribute table. The image below shows the final result of the geocoding process:
The accuracy of a geocoded location is dependent on a number of factors, including the quality of the line work in a shapefile, the accuracy of the address range attributes of each road segment, and the interpolation performed by the software. As you may see in the following section, different geocoding services may provide different location results due to the particular data and procedures used.
4.9. Geocoding Online
No doubt you’re familiar with one or more popular online mapping services. How well do they do at geocoding the location of a postal address? You can try it out for yourself at several Web-based mapping services, including MapQuest.com, Microsoft’s Bing Maps, and Tele Atlas/TomTom’s Geocode.com. Tele Atlas, for example, is a leading manufacturer of digital street data for vehicle navigation systems. To accommodate the routing tasks that navigation systems are called upon to serve, the streets are encoded as vector features whose attributes include address ranges. (In order to submit an address for geocoding at Geocode.com you have to set up a trial account through their EZ-Locate Interactive web tool or download the EZ-Locate software).
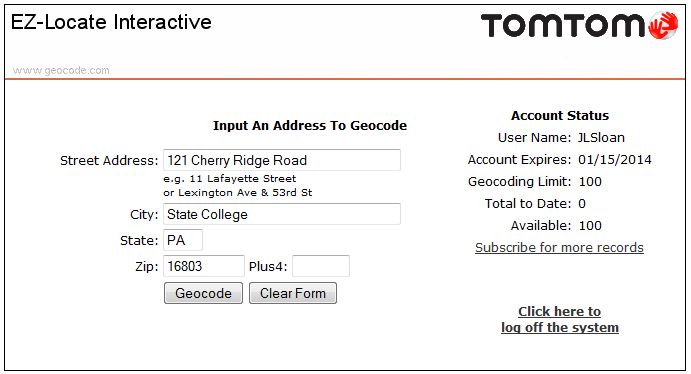
Submitting an address to Tele Atlas’ Geocode.com service for geocoding. © 2013 TomTom North America, Inc. All rights reserved.
Shown above is the form by which you can geocode an address to a location in a Tele Atlas street database. The result is shown below.
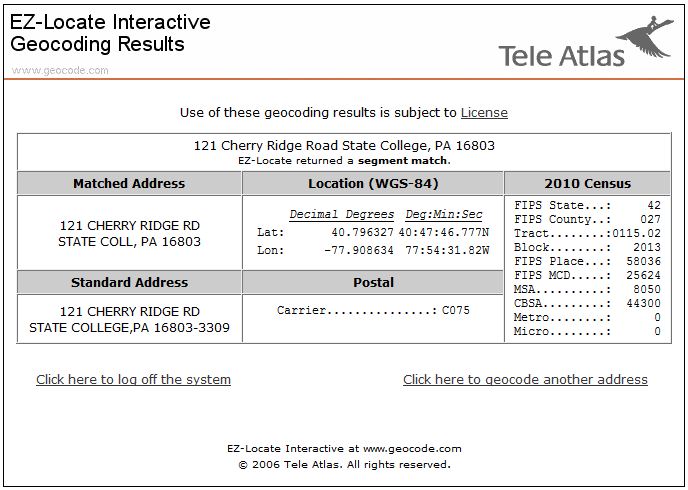
Tele Atlas’ Geocode.com service estimates the location of the address relative to the address range attributes encoded in its database. © 2013 TomTom North America, Inc. All rights reserved.
Let’s compare the geocoding capabilities of MapQuest.com to locate the address on an actual map.
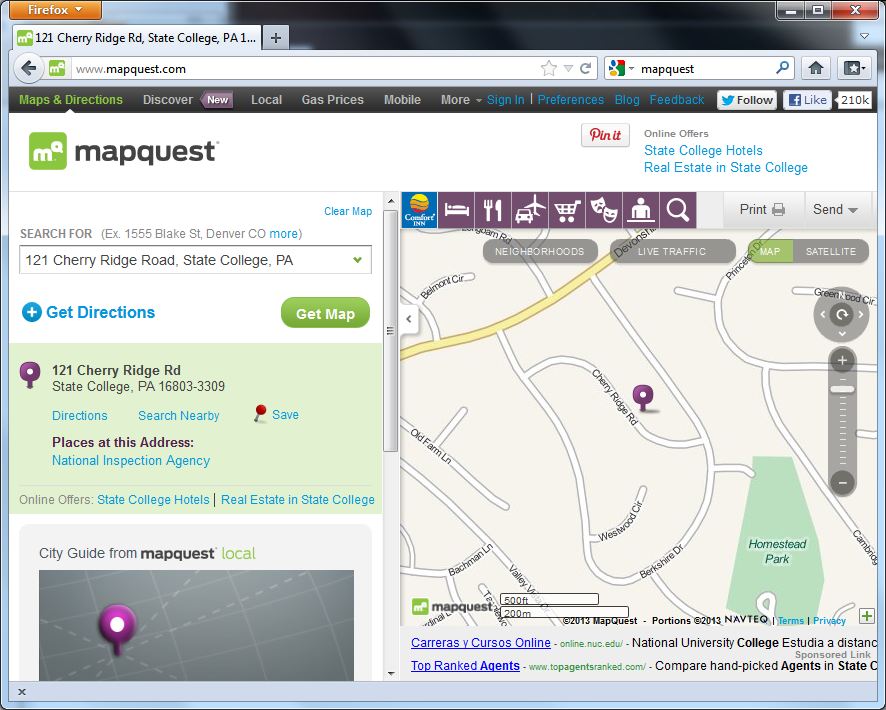
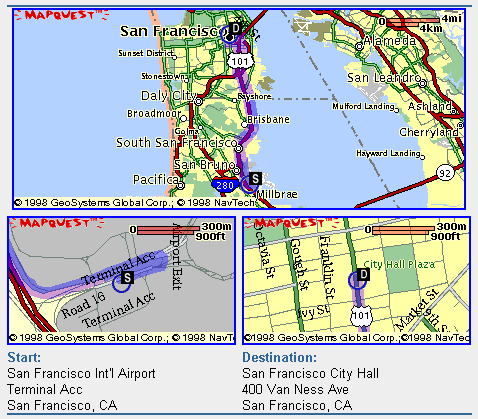
Address geocoded by MapQuest.com. © 2013 MapQuest.com, Inc. All rights reserved.
The MapQuest.com map from 2013 estimates the address is close to its actual location. Below is a similar MapQuest product created back in 1998, when this course was first being developed. On the older map the same address is plotted on the opposite side of the street. What do you suppose is wrong with the address range attribute in that case?
On the map from 1998, also note the shapes of the streets. The street shapes in the 2011 map have been improved. The 1998 product seems to have been generated from the 1990 version of the TIGER/Line files, which may have been all that was available for this relatively remote part of the country. Now MapQuest licenses street data from a business partner called NAVTEQ.
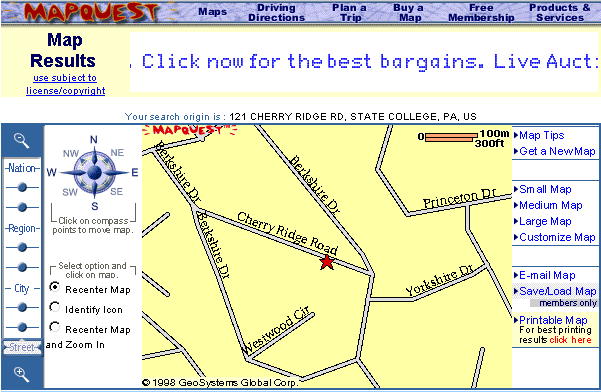
Same address geocoded by MapQuest.com in 1998. © 1998 MapQuest.com, Inc. (formerly GeoSystems Global Corp.) All rights reserved.
The point of this section is to show that geocoding with address ranges involves a process of estimation. The Census Bureau’s TIGER/Line Shapefiles, like the commercial street databases produced by Tele Atlas, Navigation Technologies, and other private firms, represent streets as vector line segments. The vector segments are associated with address range attributes, one for the left side of the street, one for the right side. The geocoding process takes a street address as input, finds the line segment that represents the specified street, checks the address ranges to determine the correct side of the street, then estimates a location at the appropriate point between the minimum and maximum address for that segment and assignes an estimated latitude/longitude coordinate to that location. For example, if the minimum address is 401, and the maximum is 421, a geocoding algorithm would locate address 411 at the midpoint of the street segment.
TRY THIS!
Try one of these geocoding services for your address. Then compare the experience, and the result, with Google Maps, launched in 2005. Apply what we’ve discussed in this chapter to try to explain inaccuracies in your results, if any. Registered students can log in and post comments directly to this page.
PRACTICE QUIZ
Registered Penn State students should return now to the Chapter 4 folder in ANGEL (via the Resources menu to the left) to take a self-assessment quiz about Geocoding.
You may take practice quizzes as many times as you wish. They are not scored and do not affect your grade in any way.
4.10. Applications beyond the Census Bureau
Two characteristics of MAF/TIGER data, address range attributes and explicit topology, make them, and derivative products, valuable in many contexts. Consequently, firms like NAVTEQ and Tele Atlas (now owned by TomTom) have emerged to provide data with similar characteristics as MAF/TIGER, but which are more up-to-date, more detailed and include additional feature classes. The purpose of the next section is to sketch some of the applications of data similar to MAF/TIGER data beyond the Census Bureau.
TRY THIS!
A February 2006 article by Peter Valdes-Dapena in CNNMoney.comdescribes the work of two NAVTEQ employees. See the link above or search on “where those driving directions really come from”
4.11. Geocoding Your Customers
Geocoded addresses allow governments and businesses to map where their constituents and customers live and work. Federal, state, and local government agencies know where their constituents live by virtue of censuses, as well as applications for licenses and registrations. Banks, credit card companies, and telecommunications firms are also rich in address-referenced customer data, including purchasing behaviors. Private businesses and services must be more resourceful.
Some retail operations, for example, request addresses or ZIP Codes from customers, or capture address data from checks. Discount and purchasing club cards allow retailers to directly match purchasing behaviors with addresses. Customer addresses can also be harvested from automobile license plates. Business owners pay to record license plate numbers of cars parked in their parking lots or in their competitors. Addresses of registered owners can be purchased from organizations that acquire motor vehicle records from state departments of transportation.
Businesses with access to address-referenced customer data, vector street data attributed with address ranges, and GIS software and expertise, can define and analyze the trade areas within which most of their customers live and work. Companies can also focus direct mail advertising campaigns on their own trade areas, or their competitors’. Furthermore, GIS can be used to analyze the socio-economic characteristics of the population within trade areas, enabling businesses to make sure that the products and services they offer meet the needs and preferences of target populations.
Politicians use the same tools to target appearances and campaign promotions.
TRY THIS!
Check out the geocoding system maintained by the Federal Financial Institution’s Examination Council. The FFIEC Geocoding system lets users enter a street address and get a census demographic report or a street map (Using Tele Atlas data). The system is intended for use by financial institutions that are covered by the Home Mortgage Disclosure Act (HMDA) and Community Reinvestment Act (CRA) to meet their reporting obligation.
4.12. Delivering Products and Services
Operations such as mail and package delivery, food and beverage distribution, and emergency medical services need to know not only where their customers are located, but how to deliver products and services to those locations as efficiently as possible. Geographic data products like TIGER/Line Shapefiles are valuable to analysts responsible for prescribing the most efficient delivery routes. The larger and more complex the service areas of such organizations, the more incentive they have to automate their routing procedures.
In its simplest form, routing involves finding the shortest path through a network from an origin to a destination. Although shortest path algorithms were originally implemented in raster frameworks, transportation networks are now typically represented with vector feature data, like TIGER/Line Shapefiles. Street segments are represented as digital line segments each formed by two points, a “start” node and an “end” node. If the nodes are specified within geographic or plane coordinate systems, the distance between them can be calculated readily. Routing procedures sum the lengths of every plausible sequence of line segments that begins and ends at the specified locations. The sequence of segments associated with the smallest sum represents the shortest route.
To compare various possible sequences of segments, the data must indicate which line segment follows immediately after another line segment. In other words, the procedure needs to know about the connectivity of features. As discussed earlier, connectivity is an example of a topological relationship. If topology is not encoded in the data product, it can be calculated by the GIS software in which the procedure is coded.
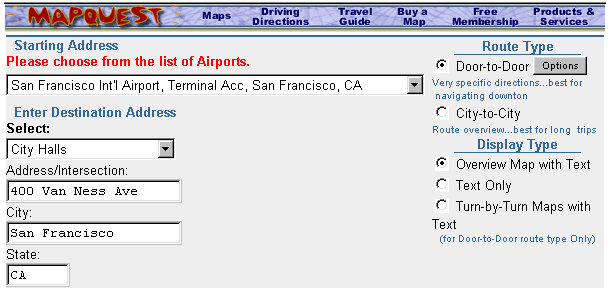
Input form for an early version of the MapQuest routing utility. © 1998 MapQuest.com, Inc. All rights reserved.
Several online travel planning services, including MapQuest.com and Google Maps, provide routing capabilities. Both take origin and destination addresses as input, and produce optimal routes as output. These services are based on vector feature databases in which street segments are attributed with address ranges, as well as with other data that describe the type and conditions of the roads they represent.
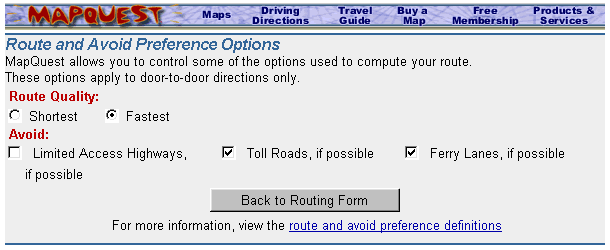
An early interface to MapQuest’s routing options. Different algorithms are required to calculate shortest and fastest routes. Specific attributes must be encoded in the database to provide the options to avoid limited access highways, toll roads, and ferry lanes. © 1998 MapQuest.com, Inc. All rights reserved.
The shortest route is not always the best. In the context of emergency medical services, for example, the fastest route is preferred, even if it entails longer distances than others. To determine fastest routes, additional attribute data must be encoded, such as speed limits, traffic volumes, one way streets, and other characteristics.
MapQuest routing solution. © 1998 MapQuest.com, Inc. All rights reserved.
Then there are routing problems that involve multiple destinations–a complex special case of routing called the traveling salesman problem. School bus dispatchers, mail and package delivery service managers, and food and beverage distributors all seek to minimize the transportation costs involved in servicing multiple, dispersed destinations. As the number of destinations and the costs of travel increase, the high cost of purchasing up-to-date, properly attributed network data becomes easier to justify.
TRY THIS
The Georgia Institute of Technology publishes an extensive collection of resources about the Traveling Salesman Problem.
4.13. Delineating Service Areas
The need to redraw voting district boundaries every ten years was one of the motivations that led the Census Bureau to create its MAF/TIGER database. Like voting districts, many other kinds of service area boundaries need to be revised periodically. School districts are a good example. The state of Massachusetts, for instance, has adopted school districting laws that are similar in effect to the constitutional criteria used to guide congressional redistricting. The Framingham (Massachusetts) School District’s Racial Balance Policy once stated that “each elementary and middle school shall enroll a student body that is racially balanced. … each student body shall include a percentage of minority student, which reflects the system-wide percentage of minority students, plus or minus ten percent. … The racial balance required by this policy shall be established by redrawing school enrollment areas” (Framingham Public Schools 1998). And bus routes must be redrawn as enrollment area boundaries change.
The Charlotte-Mecklenberg (North Carolina) public school district also used racial balance as a districting criterion (although its policy was subsequently challenged in court). Charlotte-Mecklenberg consists of 133 schools, attended by over 100,000 students, about one third of whom ride a bus to school every day. District managers are responsible for routing 3,600 bus routes, traveling a total of 82,000 daily miles. A staff of eight routinely uses GIS to manage these tasks. GIS could not be used unless up-to-date, appropriately attributed, and topologically encoded data were available.
Another example of service area analysis is provided by the City of Beaverton, Oregon. In 1997, Beaverton officials realized that 25 percent of the volume of solid waste that was hauled away to land fills consisted of yard waste, such as grass clippings and leaves. Beaverton decided to establish a yard waste recycling program, but it knew that the program would not be successful if residents found it inconvenient to participate. A GIS procedure called allocation was used to partition Beaverton’s street network into service areas that minimized the drive time from residents’ homes to recycling facilities. Allocation procedures require vector-format data that includes the features, attributes, and topology necessary to calculate travel times from all residences to the nearest facility.
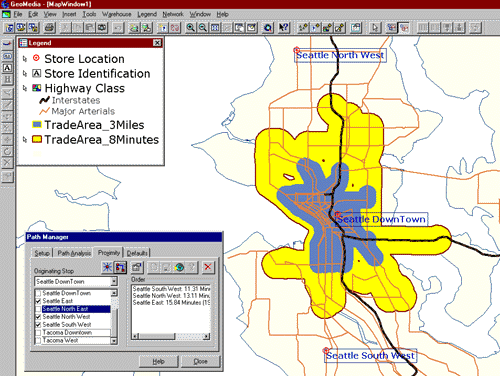
Trade areas defined by 3 miles travel distance (blue) and 8 minutes travel time (yellow). (Francica n.d.). Used by permission.
Naturally, private businesses concerned with delivering products and services are keenly interested in service area delineation. The screen capture above shows two trade areas surrounding a retail store location (“Seattle Downtown”) in a network database.
Former student Saskia Cohick (Winter 2006), who was then GIS Director for Tioga County, Pennsylvania, contributed another service area problem: “This is a topic that local governments are starting to deal with … To become Phase 2 wireless capable (that is, capable of finding a cell phone location from a 911 call center within 200 feet of the actual location), county call centers must have a layer called ESZs (Emergency Service Zones). This layer will tell the dispatcher who to send to the emergency (police, fire, medical, etc). The larger problem is to reach agreement between four fire companies (for example) as to where they do or do not respond.”
4.14. Summary
To fulfill its mission of being the preeminent producer of attribute data about the population and economy of the United States, the U.S. Census Bureau also became an innovative producer of digital geographic data. The Bureau designed its MAF/TIGER database to support automatic geocoding of address-referenced census data, as well as automatic data quality control procedures. The key characteristics of TIGER/Line Shapefiles, including use of vector features to represent geographic entities, and address range attributes to enable address geocoding, are now common features of proprietary geographic databases used for trade area analysis, districting, routing, and allocation.
QUIZ
Registered Penn State students should return now to the Chapter 4 folder in ANGEL (via the Resources menu to the left) to access the graded quiz for this chapter. This one counts. You may take graded quizzes only once.
The purpose of the quiz is to ensure that you have studied the text closely, that you have mastered the practice activities, and that you have fulfilled the chapter’s learning objectives. You are free to review the chapter during the quiz. Once you’ve submitted the quiz you will have completed Chapter 4.
COMMENTS AND QUESTIONS
Registered students are welcome to post comments, questions, and replies to questions about the text. Particularly welcome are anecdotes that relate the chapter text to your personal or professional experience. In addition, there are discussion forums available in the ANGEL course management system for comments and questions about topics that you may not wish to share with the whole world.
To post a comment, scroll down to the text box under “Post new comment” and begin typing in the text box, or you can choose to reply to an existing thread. When you are finished typing, click on either the “Preview” or “Save” button (Save will actually submit your comment). Once your comment is posted, you will be able to edit or delete it as needed. In addition, you will be able to reply to other posts at any time.
Note: the first few words of each comment become its “title” in the thread.
4.15. Bibliography
Charlotte-Mecklenberg Public Schools (n. d.). Retrieved July 19, 1999 from http://www.cms.k12.nc.us
Cooke, D. F. (1997). Topology and TIGER: The Census Bureau’s Contribution. In T. W. Foresman (Ed.), The history of geographic information systems: Perspectives from the pioneers. (pp. 47 – 57). Upper Saddle River, NJ: Prentice Hall.
Dangermond, J. (1982). A Classification of Software Components Commonly Used in Geographic Information Systems. In Proceedings of the U.S.—Australia Workshop on the Design and Implementation of Computer-Based Geographic Information Systems, Honolulu, HI, pp. 0-91. In Demers, M.N. (1997) Fundamentals of Geographic Information Systems. John Wiley & Sons, Inc.
Discreet Research (n.d.). Retrieved July 19, 1999 fromwww.dresearch.com
ESRI (1998) Shapefile Technical Description, An ESRI White paper. Environmental Systems Research Institute, Inc. Retrieved October 4, 2010, from http://www.esri.com/library/whitepapers/pdfs/shapefile.pdf
Federal Geographic Data Committee (April 2006). Retrieved July 19, 1999 from http://www.fgdc.gov
Framingham Public Schools (1998). Racial balance policy: Assignment of students to schools. Retrieved July 19, 1999 fromwww.framingham.k12.ma.us/update/0198rbp.html (since retired).
Francica, J. (n.d.). Geodezix Consulting. Retrieved July 19, 1999 fromwww.geodezix.com (since retired).
Galdi, D. (2005). Spatial Data Storage and Topology in the Redesigned MAF/TIGER System. Retrieved 19 October 2010 fromwww.census.gov/geo/mtep_obj2/topo_and_data_stor.html (since retired).
MapQuest (n.d. a). Retrieved July 19, 1998 fromhttp://www.mapquest.com
MapQuest (n.d. b). Retrieved January 15, 2013 fromhttp://www.mapquest.com
Marx, R. M. (Ed.). (1990). The Census Bureau’s TIGER system. [Special issue]. Cartography and Geographic Information Systems 17:1.
Navigation Technologies Inc. (2006). Welcome to NavTech. Retrieved July 19, 1999 from www.navtech.com
Rammage, S. and P. Woodsford (2002). The Benefits of Topoplogy in the Database. Retrieved October 6, 2010 fromhttp://spatialnews.geocomm.com/features/laserscan2/
TeleAtlas (2006). Welcome to TeleAtlas. Retrieved May 3, 2006 fromwww.teleatlas.com/Pub/Home (since retired).
Theobald, D. M. (2001). Understanding Topology and Shapefiles.ArcUser April-June 2001. Retrieved October 5, 2010 fromhttp://www.esri.com/news/arcuser/0401/topo.html
U.S. Census Bureau (1997). TIGER/Line Files (1997 Technical Documentation). Retrieved January 2, 1999 fromwww.census.gov/geo/tiger/TIGER97C.pdf (since retired).
U.S. Census Bureau (2003). TIGER/Line Files, 2003 (metadata). Retrieved February 3, 2008 fromwww.census.gov/geo/www/tlmetadata/tl2003meta.txt
U.S. Census Bureau (n. d.). 21st Century MAF/TIGER Enhancements. Retrieved February 3, 2008 fromwww.census.gov/geo/mod/overview.pdf (since retired).
U.S. Census Bureau (2004). MAF/TIGER Redesign Project Overview. Retrieved October 19, 2010 fromwww.census.gov/geo/mtep_obj2/obj2_issuepaper12_2004.pdf(since retired).
U.S. Census Bureau (2005). Geography division map gallery. Retrieved July 19, 1999 from www.census.gov/geo/www/mapGallery/
U.S. Census Bureau (2012). TIGER/Line Shapefiles Technical Documentation. Retrieved June, 2013 from of thewww.census.gov/geo/maps-data/data/pdfs/tiger/tgrshp2012/TGRSHP2012_TechDoc.pdf