16.2: Intensity and Geographic Distribution
- Page ID
- 9632

Lower sea-level pressures in the eye and faster winds in the lower troposphere indicate stronger tropical cyclones. Several different tropical cyclone scales have been devised to classify tropical cyclone strength, as summarized below.
16.2.1. Saffir-Simpson Hurricane Wind Scale
Herbert Saffir and Robert Simpson created a scale for Atlantic hurricane strength that came to be known as the Saffir-Simpson Hurricane Scale. This scale has been used since the 1970s to inform disaster-response officials about hurricane strength.
| Table 16-1. Saffir-Simpson Hurricane Wind Scale — Definition. Based on max 1-minute sustained wind speed measured at standard anemometer height of 10 m. Applies in the Atlantic Ocean, and in the eastern Pacific from the coast of the Americas to 180°W. | ||||
| Category | Wind Speed | |||
|---|---|---|---|---|
| m s–1 | km h–1 | knots | miles h–1 | |
| 1 | 33 - 42 | 119 - 153 | 64 - 82 | 74 - 95 |
| 2 | 43 - 49 | 154 - 177 | 83 - 95 | 96 - 110 |
| 3 | 50 - 58 | 178 - 209 | 96 - 112 | 111 - 129 |
| 4 | 59 - 69 | 209 - 251 | 113 - 136 | 130 - 156 |
| 5 | ≥ 70 | ≥ 252 | ≥ 137 | ≥ 157 |
| Table 16-2. Saffir-Simpson Hurricane Wind Scale — Description of Expected Damage — Examples. | |
| Category | Concise Statement |
| Damage Expected | |
| Examples | |
| 1 | Very dangerous winds will produce some damage. |
| People, livestock, and pets struck by flying or falling debris could be injured or killed. Older (mainly pre-1994 construction) mobile homes could be destroyed, especially if they are not anchored properly as they tend to shift or roll off their foundations. Newer mobile homes that are anchored properly can sustain damage involving the removal of shingle or metal roof coverings, and loss of vinyl siding, as well as damage to carports, sunrooms, or lanais. Some poorly constructed frame homes can experience major damage, involving loss of the roof covering and damage to gable ends as well as the removal of porch coverings and awnings. Unprotected windows may break if struck by flying debris. Masonry chimneys can be toppled. Well-constructed frame homes could have damage to roof shingles, vinyl siding, soffit panels, and gutters. Failure of aluminum, screened-in swimming pool enclosures can occur. Some apartment building and shopping center roof coverings could be partially removed. Industrial buildings can lose roofing and siding especially from windward corners, rakes, and eaves. Failures to overhead doors and unprotected windows will be common. Windows in high-rise buildings can be broken by flying debris. Falling and broken glass will pose a significant danger even after the storm. There will be occasional damage to commercial signage, fences, and canopies. Large branches of trees will snap and shallow rooted trees can be toppled. Extensive damage to power lines and poles will likely result in power outages that could last a few to several days. | |
| Hurricane Dolly (2008) brought Category 1 winds and impacts to South Padre Island, Texas | |
| 2 | Extremely dangerous winds will cause extensive damage. |
| There is a substantial risk of injury or death to people, livestock, and pets due to flying and falling debris. Older (mainly pre-1994 construction) mobile homes have a very high chance of being destroyed and the flying debris generated can shred nearby mobile homes. Newer mobile homes can also be destroyed. Poorly constructed frame homes have a high chance of having their roof structures removed especially if they are not anchored properly. Unprotected windows will have a high probability of being broken by flying debris. Well-constructed frame homes could sustain major roof and siding damage. Failure of aluminum, screened-in swimming pool enclosures will be common. There will be a substantial percentage of roof and siding damage to apartment buildings and industrial buildings. Unreinforced masonry walls can collapse. Windows in high-rise buildings can be broken by flying debris. Falling and broken glass will pose a significant danger even after the storm. Commercial signage, fences, and canopies will be damaged and often destroyed. Many shallowly rooted trees will be snapped or uprooted and block numerous roads. Near-total power loss is expected with outages that could last from several days to weeks. Potable water could become scarce as filtration systems begin to fail. | |
| Hurricane Frances (2004) brought Category 2 winds and impacts to coastal portions of Port St. Lucie, Florida. | |
| 3 | Devastating damage will occur. |
| There is a high risk of injury or death to people, livestock, and pets due to flying and falling debris. Nearly all older (pre-1994) mobile homes will be destroyed. Most newer mobile homes will sustain severe damage with potential for complete roof failure and wall collapse. Poorly constructed frame homes can be destroyed by the removal of the roof and exterior walls. Unprotected windows will be broken by flying debris. Well-built frame homes can experience major damage involving the removal of roof decking and gable ends. There will be a high percentage of roof covering and siding damage to apartment buildings and industrial buildings. Isolated structural damage to wood or steel framing can occur. Complete failure of older metal buildings is possible, and older unreinforced masonry buildings can collapse. Numerous windows will be blown out of high-rise buildings resulting in falling glass, which will pose a threat for days to weeks after the storm. Most commercial signage, fences, and canopies will be destroyed. Many trees will be snapped or uprooted, blocking numerous roads. Electricity and potable water will be unavailable for several days to a few weeks after the storm passes. | |
| Hurricane Ivan (2004) brought Category 3 winds and impacts to coastal portions of Gulf Shores, Alabama. | |
| 4 | Catastrophic damage will occur. |
| There is a very high risk of injury or death to people, livestock, and pets due to flying and falling debris. Nearly all older (pre-1994) mobile homes will be destroyed. A high percentage of newer mobile homes also will be destroyed. Poorly constructed homes can sustain complete collapse of all walls as well as the loss of the roof structure. Well-built homes also can sustain severe damage with loss of most of the roof structure and/or some exterior walls. Extensive damage to roof coverings, windows, and doors will occur. Large amounts of windborne debris will be lofted into the air. Windborne debris damage will break most unprotected windows and penetrate some protected windows. There will be a high percentage of structural damage to the top floors of apartment buildings. Steel frames in older industrial buildings can collapse. There will be a high percentage of collapse to older unreinforced masonry buildings. Most windows will be blown out of highrise buildings resulting in falling glass, which will pose a threat for days to weeks after the storm. Nearly all commercial signage, fences, and canopies will be destroyed. Most trees will be snapped or uprooted and power poles downed. Fallen trees and power poles will isolate residential areas. Power outages will last for weeks to possibly months. Long-term potable-water shortages will increase human suffering. Most of the area will be uninhabitable for weeks or months. | |
| Hurricane Charley (2004) brought Category 4 winds and impacts to coastal portions of Punta Gorda, Florida. | |
| 5 | Catastrophic damage will occur. |
| People, livestock, and pets are at very high risk of injury or death from flying or falling debris, even if indoors in mobile homes or framed homes. Almost complete destruction of all mobile homes will occur, regardless of age or construction. A high percentage of frame homes will be destroyed, with total roof failure and wall collapse. Extensive damage to roof covers, windows, and doors will occur. Large amounts of windborne debris will be lofted into the air. Windborne debris damage will occur to nearly all unprotected windows and many protected windows. Significant damage to wood roof commercial buildings will occur due to loss of roof sheathing. Complete collapse of many older metal buildings can occur. Most unreinforced masonry walls will fail, which can lead to collapse of buildings. A high percentage of industrial buildings and low-rise apartment buildings will be destroyed. Nearly all windows will be blown out of high-rise buildings resulting in falling glass, which will pose a threat for days to weeks after the storm. Nearly all commercial signage, fences, and canopies will be destroyed. Nearly all trees will be snapped or uprooted and power poles downed. Fallen trees and power poles will isolate residential areas. Power outages will last for weeks to possibly months. Long-term potable-water shortages will increase human suffering. Most of the area will be uninhabitable for weeks or months. | |
| Hurricane Andrew (1992) brought Category 5 winds and impacts to coastal portions of Cutler Ridge, Florida. | |
From an online report “The Saffir-Simpson Hurricane Wind Scale”, National Hurricane Center, National Weather Service, NOAA. 2010.
In 2010, the US National Hurricane Center updated this scale (now called the Saffir-Simpson Hurricane Wind Scale), and defined hurricane intensity on wind speed only (Table 16-1). The scale ranges from category 1 for a weak hurricane to category 5 for a strong hurricane. Table 16-2 has a description of the expected damage for each category.
16.2.2. Typhoon Intensity Scales
For typhoons in the western North Pacific Ocean, storm intensity has been classified three different ways by three different organizations: the Japan Meteorological Agency (JMA), the Hong Kong Observatory (HKO), and the US Joint Typhoon Warning Center (JTWC). See Table 16-3.
16.2.3. Other Tropical-Cyclone Scales
Additional tropical-cyclone intensity scales (with different max wind-speed Mmax definitions and category names) have been defined by agencies in:
- Australia (Australian Bureau of Meteorology, for S. Hemisphere east of 90°E). Cat. 1 for Mmax < 125; Cat. 2 for 125 ≤ Mmax ≤ 164; Cat. 3 for 165 ≤ Mmax ≤ 224; Cat. 4 for 225 ≤ Mmax ≤ 279; and Cat. 5 for 280 < Mmax , where all winds are in km h–1.
- India (Regional Specialized Meteorological Center in New Delhi, for N. Hemisphere Indian Ocean between 45°E and 100°E).
- France (Météo-France, for S. Hemisphere west of 90°E).
Even more confusing, some agencies use 1-minute average (sustained) winds, some use 10-minute average (sustained) winds, and some use gusts.
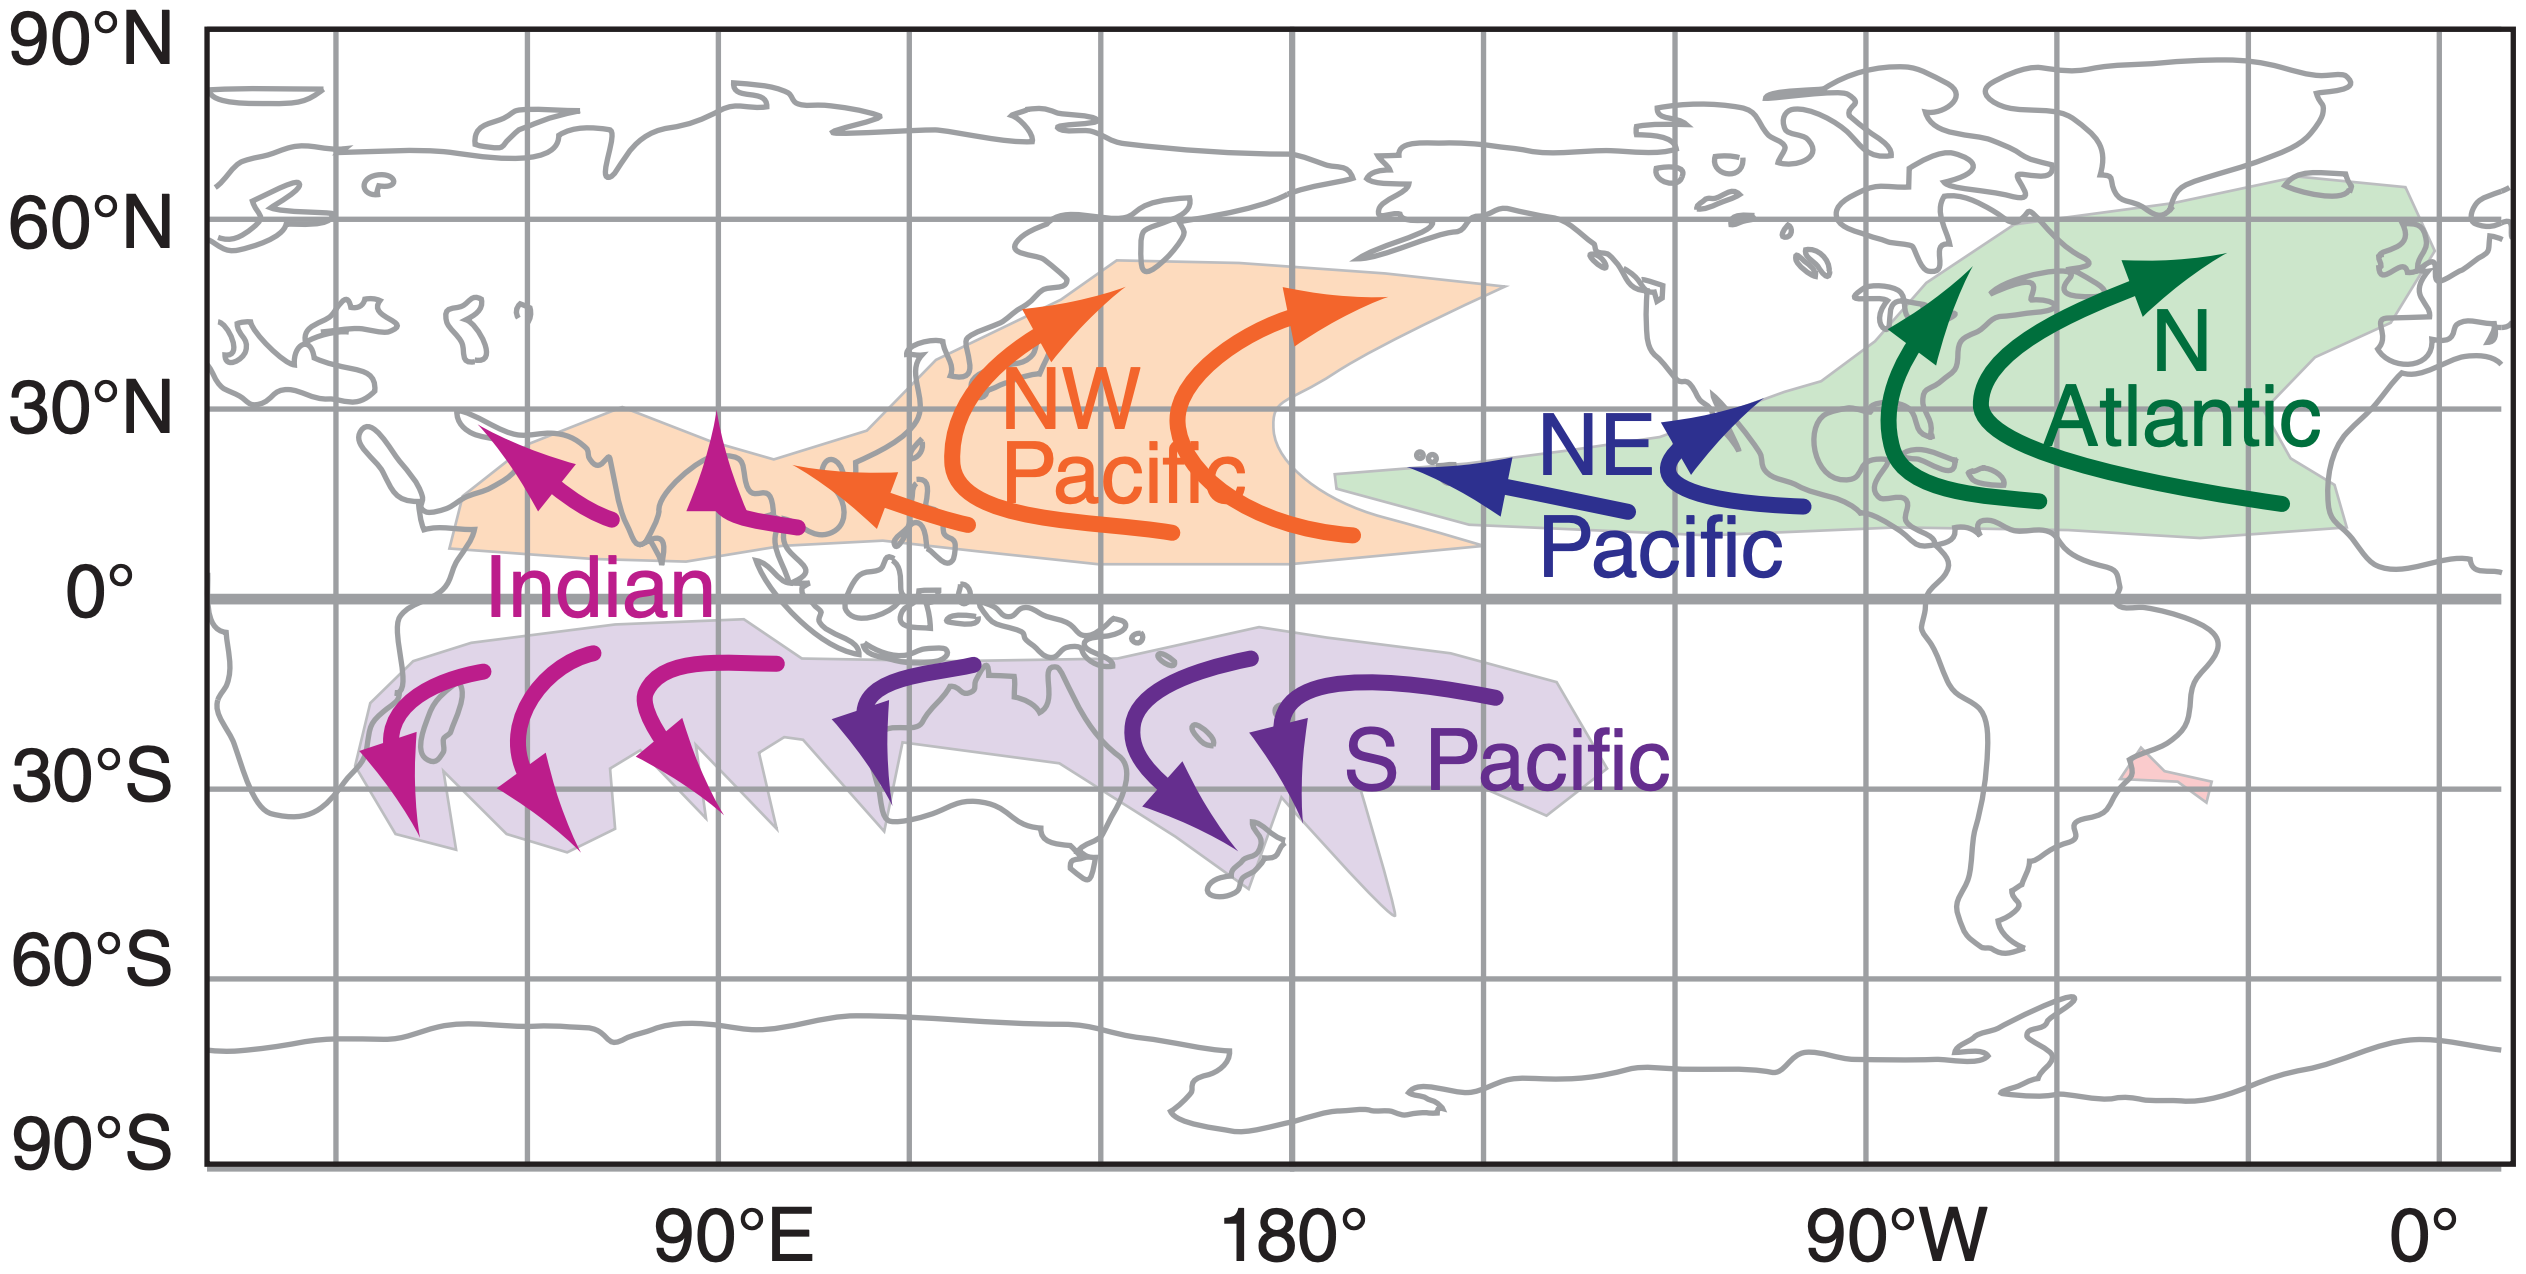
16.2.4. Geographic Distribution and Movement
Fig. 16.7 outlines the regions of greatest frequency of tropical cyclones and shows typical storm tracks.
Tropical cyclones are steered mostly by the large-scale global circulation. Most tropical cyclones form between 10° and 30° latitude, which is the trade-wind region. Hence, most tropical cyclones are steered from east to west initially
Later, these storms tend to turn poleward under the influence of monsoon circulations. For example, the Bermuda High (also known as the Azores High) over the North Atlantic Ocean has a clockwise circulation around it (see Fig. 11.31 in the General Circulation chapter), which turns tropical cyclones northward in the Western North Atlantic Ocean. The tracks of tropical cyclones and storms that have weakened from tropical cyclones to tropical storms continue to turn toward the northeast as they proceed further into the mid-latitudes and encounter west winds in the global circulation.
A striking observation in Fig. 16.7 is that no tropical cyclones form at the equator. Also, none cross the equator. The next section explains why.
The total amount of destruction depends on the area of hurricane force winds, max wind speed, and the storm duration over any location. For this reason, the insurance industry utilizes a cyclone damage potential index (CDP) defined as follows:
\(C D P=\left(\frac{M_{t o}}{M_{t}}\right) \cdot\left[\left(\frac{M_{\max }}{M_{\max o}}\right)^{3}+5\left(\frac{R_{h}}{R_{h o}}\right)\right]\)
where Mt = translation speed (km h–1) of the eye, Mmax is max surface wind speed (km h–1), Rh = average radius (km) of hurricane force winds, and the corresponding parameters are Mto = 7.4 km h–1, Mmaxo = 120 km h–1, Rho = 96 km. If Mt < 9.25 km h–1, then set Mt = 9.25 km h–1. CDP varies between 0 and 10 (dimensionless), with 10 indicating the worst destruction.
For example, when hurricane Katrina was a category 5 storm before landfall, it had Mt = 20 km h–1, Mmax =280 km h–1, & Rh = 100 km, yielding CDP ≈ 6.7 .
| Table 16-3. Typhoon (tropical cyclone) intensity scale, based on max sustained winds during 10-minute periods. Defined by JMA, unless otherwise noted. Applies between 100°E to 180°E. | |||
| Category |
Wind Speed | ||
|---|---|---|---|
| m s–1 | km h–1 | knots | |
| Tropical Depression | < 17 | < 61 | < 33 |
| Tropical Storm | 17 - 24 | 62 - 88 | 34 - 47 |
| Severe Tropical Storm | 25 - 32 | 89 - 117 | 48 - 63 |
| Typhoon | 33 - 41 | 118- 56 | 64 - 74 |
| Severe (or Very Strong) Typhoon | 42 - 51 (HKO) 44 - 54 | 150 - 184 (HKO) 157 - 193 | 80 - 99 (HKO) 85 - 104 |
|
Super Typhoon |
> 51 (HKO) > 59 (JTWC) |
>185 (HKO) > 211 (JTWC) > 194 |
>100 (HKO) > 114 (JTWC) > 105 |