
12.1: Anticyclones or Highs
- Page ID
- 9603

12.1.1. Characteristics & Formation
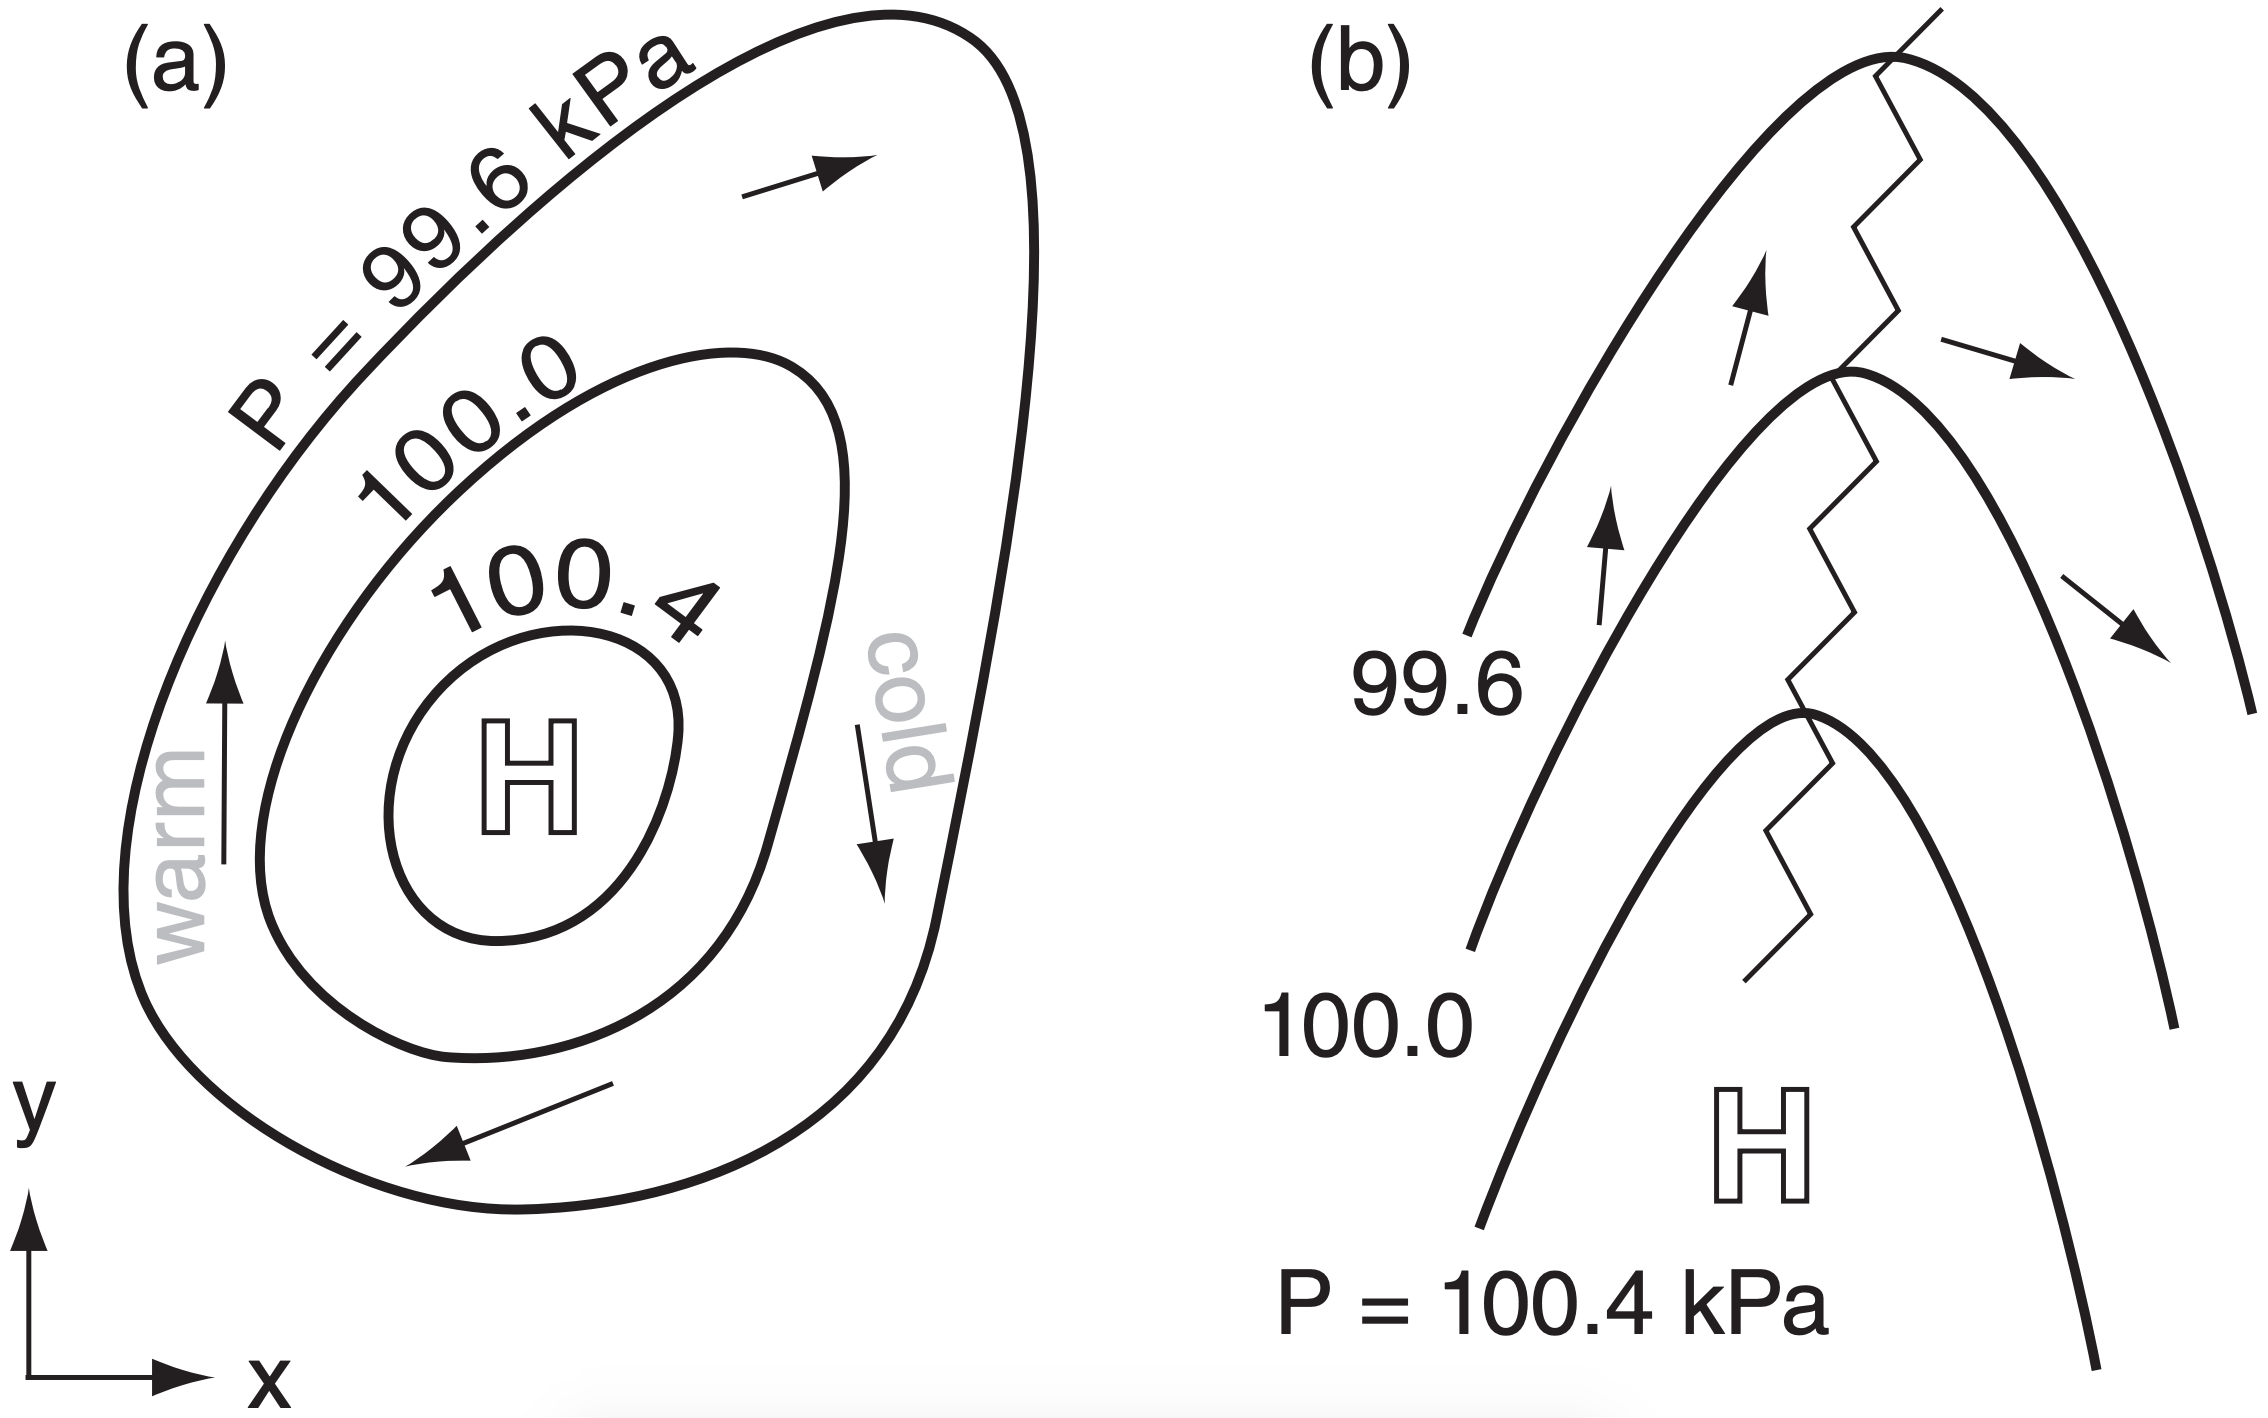
High-pressure centers, or highs, are identified on constant altitude (e.g., sea-level) weather maps as regions of relative maxima in pressure. The location of high-pressure center is labeled with “H” (Fig. 12.2a). High centers can also be found on upper-air isobaric charts as relative maxima in geopotential height (see the Atmos. Forces & Winds chapter, Fig. 10.2).
When the pressure field has a relative maximum in only one direction, such as east-west, but has a horizontal pressure-gradient in the other direction, this is called a high-pressure ridge (Fig. 12.2b). The ridge axis is labeled with a zigzag line.
The column of air above the high center contains more air molecules than neighboring columns. This causes more weight due to gravity (see Chapter 1), which is expressed in a fluid as more pressure.
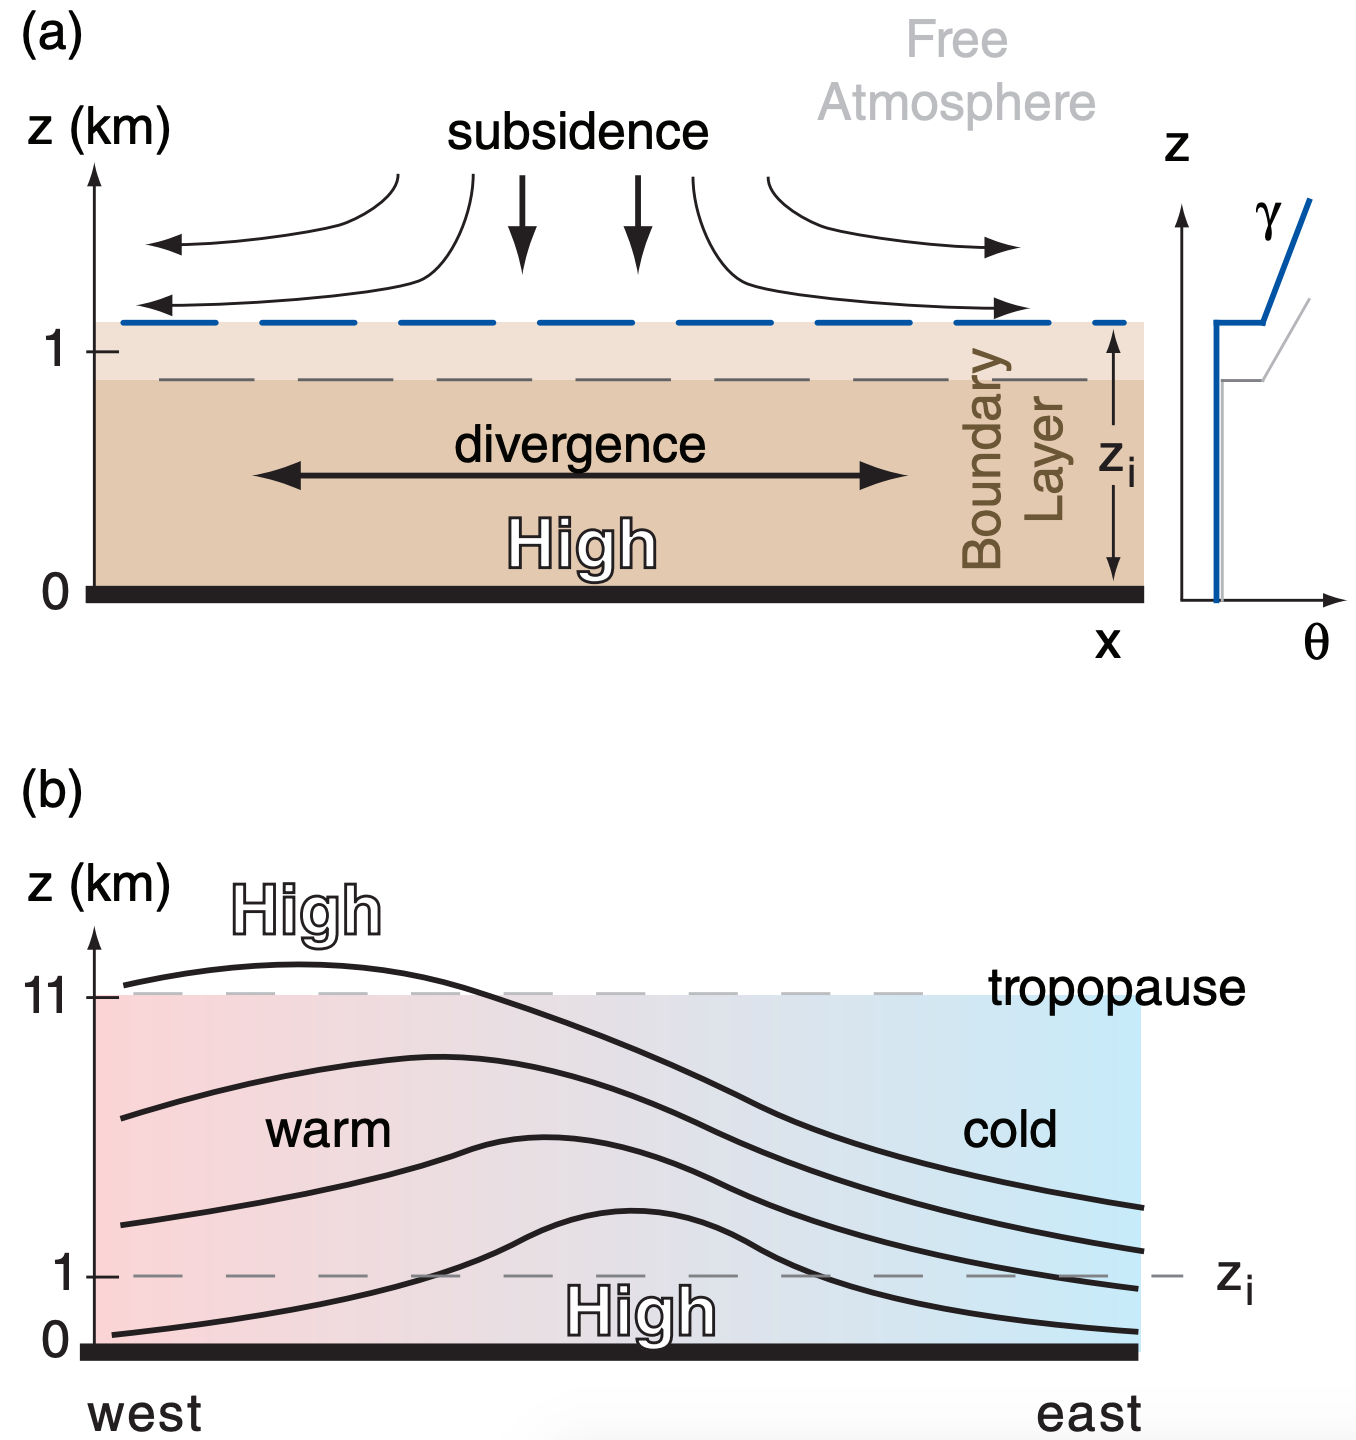
Above a high center is often downward motion (subsidence) in the mid-troposphere, and horizontal spreading of air (divergence) near the surface (Fig. 12.3a). Subsidence impedes cloud development, leading to generally clear skies and fair weather. Winds are also generally calm or light in highs, because gradient-wind dynamics of highs require weak pressure gradients near the high center (see the Atmos. Forces & Winds chapter).
The diverging air near the surface spirals outward due to the weak pressure-gradient force. Coriolis force causes it to rotate clockwise (anticyclonically) around the high-pressure center in the Northern Hemisphere (Fig. 12.2a), and opposite in the Southern Hemisphere. For this reason, highpressure centers are called anticyclones.
Downward advection of dry air from the upper troposphere creates dry conditions just above the boundary layer. Subsidence also advects warmer potential temperatures from higher in the troposphere. This strengthens the temperature inversion that caps the boundary layer, and acts to trap pollutants and reduce visibility near the ground.
Subsiding air cannot push through the capping inversion, and therefore does not inject free-atmosphere air directly into the boundary layer. Instead, the whole boundary layer becomes thinner as the top is pushed down by subsidence (Fig. 12.3a). This can be partly counteracted by entrainment of free atmosphere air if the boundary layer is turbulent, such as for a convective mixed layer during daytime over land. However, the entrainment rate is controlled by turbulence in the boundary layer (see the Atmos. Boundary Layer chapter), not by subsidence.
Five mechanisms support the formation of highs at the Earth’s surface:
- Global Circulation: Planetary-scale, semi-permanent highs predominate at 30° and 90° latitudes, where the global circulation has downward motion (see the General Circulation chapter). The subtropical highs centered near 30° North and South latitudes are 1000-km-wide belts that encircle the Earth. Polar highs cover the Arctic and Antarctic. These highs are driven by the global circulation that is responding to differential heating of the Earth. Although these highs exist year round, their locations shift slightly with season.
- Monsoons: Quasi-stationary, continentalscale highs form over cool oceans in summer and cold continents in winter (see the General Circulation chapter). They are seasonal (i.e., last for several months), and form due to the temperature contrast between land and ocean.
- Transient Rossby waves: Surface highs form at mid-latitudes, east of high-pressure ridges in the jet stream, and are an important part of mid-latitude weather variability (see the General Circulation and Extratropical Cyclone chapters). They often exist for several days.
- Thunderstorms: Downdrafts from thunderstorms (see the Thunderstorm chapters) create meso-highs roughly 10 to 20 km in diameter at the surface. These might exist for minutes to hours.
- Topography/Surface-Characteristics: Mesohighs can also form in mountains due to blocking or channeling of the wind, mountain waves, and thermal effects (anabatic or katabatic winds) in the mountains. Sea-breezes or lake breezes can also create meso-highs in parts of their circulation. (See the Regional Winds chapter.)
The actual pressure pattern at any location and time is a superposition of all these phenomena.
12.1.2. Vertical Structure
The location difference between surface and upper-tropospheric highs (Fig. 12.3b) can be explained using gradient-wind and thickness concepts.
Because of barotropic and baroclinic instability, the jet stream meanders north and south, creating troughs of low pressure and ridges of high pressure, as discussed in the General Circulation chapter. Gradient winds blow faster around ridges and slower around troughs, assuming identical pressure gradients. The region east of a ridge and west of a trough has fast-moving air entering from the west, but slower air leaving to the east. Thus, horizontal convergence of air at the top of the troposphere adds more air molecules to the whole tropospheric column at that location, causing a surface high to form east of the upper-level ridge.
West of surface highs, the anticyclonic circulation advects warm air from the equator toward the poles (Figs. 12.2a & 12.3b). This heating west of the surface high causes the thickness between isobaric surfaces to increase, as explained by the hypsometric equation. Isobaric surfaces near the top of the troposphere are thus lifted to the west of the surface high. These high heights correspond to high pressure aloft; namely, the upper-level ridge is west of the surface high.
The net result is that high-pressure regions tilt westward with increasing height (Fig. 12.3b). In the Extratropical Cyclone chapter you will see that deepening low-pressure regions also tilt westward with increasing height, at mid-latitudes. Thus, the mid-latitude tropospheric pressure pattern has a consistent phase shift toward the west as altitude increases.