
1.6: Thermodynamic State
- Page ID
- 9529

The thermodynamic state of air is measured by its pressure (P), density (ρ), and temperature (T).
1.4.1. Temperature
When a group of molecules (microscopic) move predominantly in the same direction, the motion is called wind (macroscopic). When they move in random directions, the motion is associated with temperature. Higher temperatures T are associated with greater average molecular speeds v :
\(\ \begin{align} T=a\cdot m_{\omega} \cdot v^2\tag{1.5} \end{align}\)
where a = 4.0x10⁻⁵ K·m–2 ·s2 ·mole·g–1 is a constant. Molecular weights \(\ m_{\omega}\) for the most common gases in the atmosphere are listed in Table 1-2.
[CAUTION: symbol “a” represents different constants for different equations, in this textbook. ]
Sample Application
What is the average random velocity of nitrogen molecules at 20°C ?
 Find the Answer
Given: T = 273.15 + 20 = 293.15 K.
Find: v = ? m s–1 (=avg mol. velocity)
Get \(\ m_{\omega}\) from Table 1-2. Solve eq. (1.5) for v:
\(\
v=[T/a \cdot m_{\omega}]^{1/2}
\)
= [(293.15 K)/(4.0x10–5 K·m–2·s2·mole/g) ·( 28.01g/mole)]1/2 = 511.5 m s–1 .
Check: Units OK. Sketch OK. Physics OK.
Exposition: Faster than a speeding bullet.
Table 1-2. Characteristics of gases in the air near the ground. Molecular weights are in g mole–1. The volume fraction indicates the relative contribution to air in the Earth’s lower atmosphere. EPA is the USA Environmental Protection Agency.
| Symbol | Name | Mol. Wt. | Volume Fraction% |
|---|---|---|---|
| Constant Gases (NASA 2015) | |||
|
N2 O2 Ar Ne He Kr H2 Xe |
Nitrogen Oxygen Argon Neon Helium Krypton Hydrogen Xenon |
28.01 32.00 39.95 20.18 4.00 83.80 2.02 131.29 |
78.08 20.95 0.934 0.001 818 0.000 524 0.000 114 0.000 055 0.000 009 |
| Variable Gases | |||
|
H2O CO2 CH4 N2O |
Water vapor Carbon dioxide Methane Nitrous oxide |
18.02 44.01 16.04 44.01 |
0 to 4 0.040 0.00017 0.00003 |
|
EPA National Ambient Air Quality Standards (NAAQS. 1990 Clean Air Act Amendments. Rules through 2011) |
|||
|
CO SO2 O3 NO2 |
Carbon monoxide (8 h average) (1 h average) Sulfur dioxide (3 h average) (1 h average) Ozone (8 h average) Nitrogen dioxide (annual average) (1 h average) |
28.01 64.06 48.00 46.01 |
0.0009 0.0035 0.00000005 0.0000075 0.0000075 0.0000053 0.0000100 |
| Mean Condition for Air | |||
| air | 28.96 | 100.0 | |
| Table 1-3. Standard (average) sea-level pressure. | |
| Value | Units |
|
101.325 kPa 1013.25 hPa 101,325. Pa 101,325. N·m–2 101,325 kgm·m–1·s–2 1.033227 kgf ·cm–2 1013.25 mb 1.01325 bar 14.69595 psi 2116.22 psf 1.033227 atm 760 Torr |
kiloPascals (recommended) hectoPascals (allowed) Pascals Newtons per square meter kg-mass per meter per s2 kg-force per square cm millibars bars pounds-force /square inch pounds-force / square foot atmosphere Torr |
| Measured as height of fluid in a barometer: | |
|
29.92126 in Hg 760 mm Hg 33.89854 ft H2O 10.33227 m H2O |
inches of mercury millimeters of mercury feet of water meters of water |
Absolute units such as Kelvin (K) must be used for temperature in all thermodynamic and radiative laws. Kelvin is the recommended temperature unit. For everyday use, and for temperature differences, you can use degrees Celsius (°C).
Degrees Celsius (°C) and degrees Fahrenheit (°F) must always be prefixed with the degree symbol (°) to avoid confusion with the electrical units of coulombs (C) and farads (F), but Kelvins (K) never take the degree symbol.
At absolute zero (T = 0 K = –273.15°C) the molecules are essentially not moving. Temperature conversion formulae are:
\(\ \begin{align} T_{\circ{F}}=\left[(9 / 5) \cdot T_{\circ C}\right]+32 \tag{1.6a} \end{align}\)
\(\ \begin{align} T_{\circ{C}}=[(5 / 9)\cdot[T_{\circ F}-32] \tag{1.6b} \end{align}\)
\(\ \begin{align} T_k = T_{\circ C}+273.15 \tag{1.7a} \end{align}\)
\(\ \begin{align} T_{\circ C}=T_K-273.15 \tag{1.7b} \end{align}\)
For temperature differences, you can use ΔT(°C) = ΔT(K), because the size of one degree Celsius is the same as the size of one unit of Kelvin. Hence, only in terms involving temperature differences can you arbitrarily switch between °C and K without needing to add or subtract 273.15.
Standard (average) sea-level temperature is: T = 15.0°C = 288 K = 59°F.
Actual temperatures can vary considerably over the course of a day or year. Temperature variation with height is not as simple as the curves for pressure and density, and will be discussed in the Standard Atmosphere section a bit later.
1.4.2. Pressure
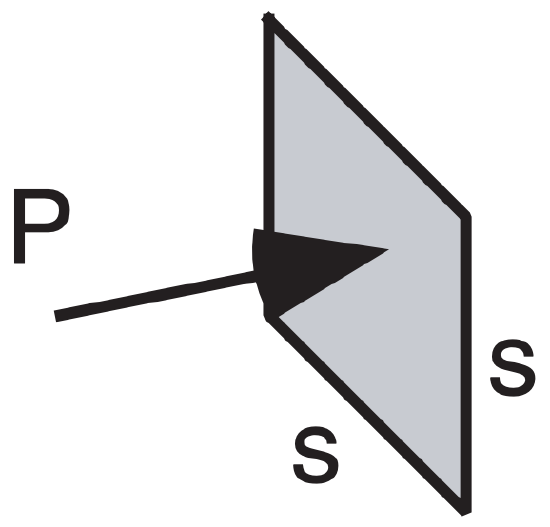
Pressure P is the force F acting perpendicular (normal) to a surface, per unit surface area A:
\(\ \begin{align} P=F/A \tag{1.8} \end{align}\)
Static pressure (i.e., pressure in calm winds) is caused by randomly moving molecules that bounce off each other and off surfaces they hit. In a vacuum the pressure is zero.
In the International System of Units (SI), a Newton (N) is the unit for force, and m2 is the unit for area. Thus, pressure has units of Newtons per square meter, or N·m–2. One Pascal (Pa) is defined to equal a pressure of 1 N·m–2. The recommended unit for atmospheric pressure is the kiloPascal (kPa). The average (standard) pressure at sea level is P = 101.325 kPa. Pressure decreases nearly exponentially with height in the atmosphere, below 105 km.
Sample Application
The picture tube of an old TV and the CRT display of an old computer are types of vacuum tube. If there is a perfect vacuum inside the tube, what is the net force pushing against the front surface of a big screen 24 inch (61 cm) display that is at sea level?
Find the Answer
Given: Picture tube sizes are quantified by the diagonal length d of the front display surface. Assume the picture tube is square. The length of the side s of the tube is found from: d2 = 2 s2 . The frontal surface area is
A = s2 = 0.5 · d2 = 0.5 · (61 cm)2 = 1860.5 cm2 = (1860.5 cm2)·(1 m/100 cm)2 = 0.186 m2 .
At sea level, atmospheric pressure pushing against the outside of the tube is 101.325 kPa, while from the inside of the tube there is no force pushing back because of the vacuum. Thus, the pressure difference across the tube face is
ΔP = 101.325 kPa = 101.325x10³ N m–2.
Find: ΔF = ? N, the net force across the tube.
Sketch:
\(\begin{aligned} \Delta F &=F_{\text {outside }}-F_{\text {inside }}, \text { but } F=P \cdot A . \text { from eq. } \\ &=\left(P_{\text {outside }}-P_{\text {inside }}\right) \cdot A \\ &=\Delta P \cdot A \\ &=\left(101.325 \times 10^{3} \mathrm{N} \mathrm{m}^{-2}\right) \cdot\left(0.186 \mathrm{m}^{2}\right) \\ &=1.885 \times 10^{4} \mathrm{N}=18.85 \mathrm{kN} \end{aligned}\)
Check: Units OK. Physically reasonable
Exposition: This is quite a large force, and explains why picture tubes are made of such thick heavy glass. For comparison, a person who weighs 68 kg (150 pounds) is pulled by gravity with a force of about 667 N (= 0.667 kN). Thus, the picture tube must be able to support the equivalent of 28 people standing on it!
While kiloPascals will be used in this book, standard sea-level pressure in other units are given in Table 1-3 for reference. Ratios of units can be formed to allow unit conversion (see Appendix A). Although meteorologists are allowed to use hectoPascals (as a concession to those meteorologists trained in the previous century, who had grown accustomed to millibars), the prefix “hecto” is non-standard. If you encounter weather maps using millibars or hectoPascals, you can easily convert to kiloPascals by moving the decimal point one place to the left.
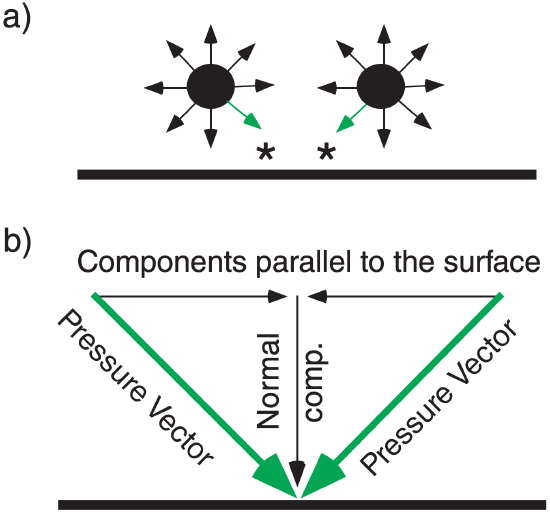
In fluids such as the atmosphere, pressure force is isotropic; namely, at any point it pushes with the same force in all directions (see Figure 1.7a). Similarly, any point on a solid surface experiences pressure forces in all directions from the neighboring fluid elements. At such solid surfaces, all forces cancel except the forces normal (perpendicular) to the surface (Figure 1.7b).
Atmospheric pressure that you measure at any altitude is caused by the weight of all the air molecules above you. As you travel higher in the atmosphere there are fewer molecules still above you; hence, pressure decreases with height. Pressure can also compress the air causing higher density (i.e., more molecules in a given space). Compression is greatest where the pressure is greatest, at the bottom of the atmosphere. As a result of more molecules being squeezed into a small space near the bottom than near the top, ambient pressure decreases faster near the ground than at higher altitudes.
Pressure change is approximately exponential with height, z. For example, if the temperature (T) were uniform with height (which it is not), then:
\(\ \begin{align} P=P_{o} \cdot e^{-(a / T) \cdot z} \tag{1.9a} \end{align}\)
where a = 0.0342 K m–1, and where average sea-level pressure on Earth is Po = 101.325 kPa. For more realistic temperatures in the atmosphere, the pressure curve deviates slightly from exponential. This will be discussed in the section on atmospheric structure. [CAUTION again: symbol “a” represents different constants for different equations, in this textbook. ] Equation (1.9a) can be rewritten as:
\(\ \begin{align} P=P_{0} \cdot e^{-z / H_{p}} \tag{1.9b} \end{align}\)
where Hp = 7.29 km is called the scale height for pressure. Mathematically, Hp is the e-folding distance for the pressure curve.
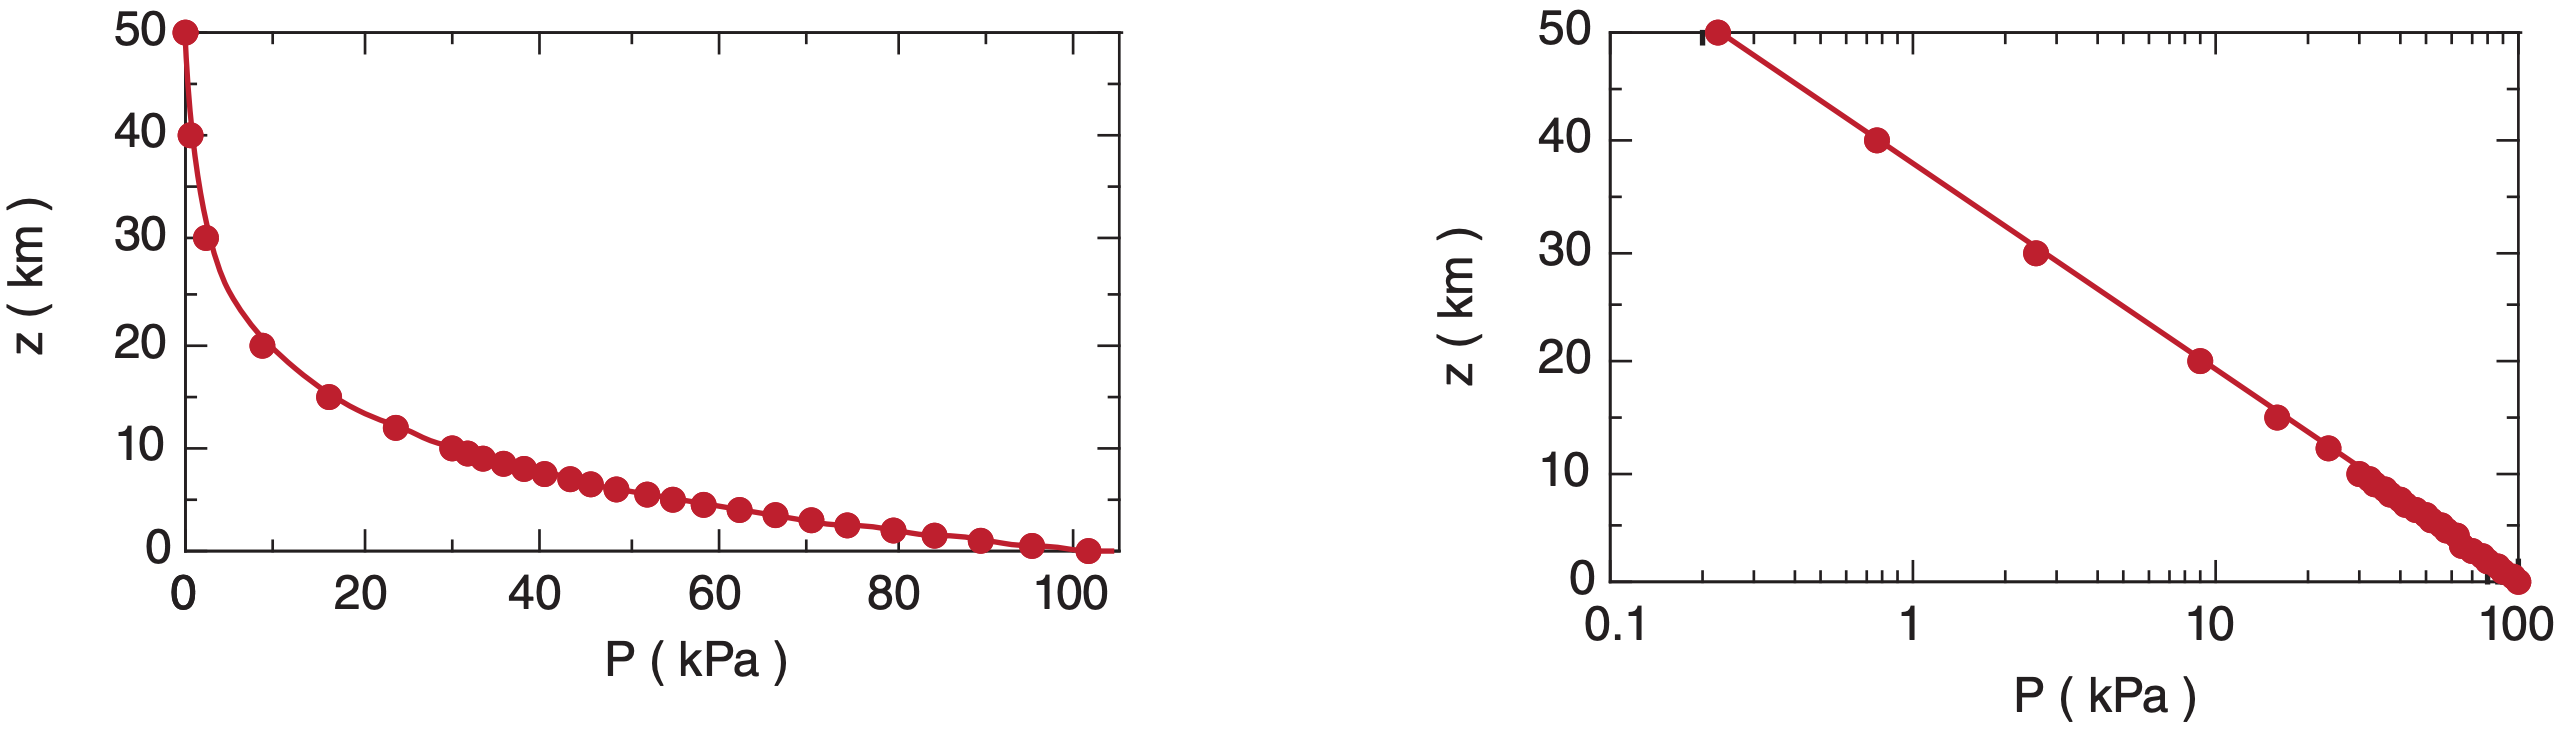
Figure 1.8 shows the relationship between P and z on linear and semi-log graphs, for T = 280 K. [Graph types are reviewed in Appendix A.] In the lowest 3 km of the atmosphere, pressure decreases nearly linearly with height at about (10 kPa)/(1 km).
Because of the monotonic decrease of pressure with height, pressure can be used as a surrogate measure of altitude. (Monotonic means that it changes only in one direction, even though the rate of change might vary.) Figure 1.4 shows such an example, where a reversed logarithmic scale (greater pressure at the bottom of the axis) is commonly used for P. Aircraft also use pressure to estimate their altitude.
In the atmosphere, the pressure at any height z is related to the mass of air above that height. Under the influence of gravity, air mass m has weight F = m·|g| , where |g| = 9.8 m·s–2 is gravitational acceleration at the Earth’s surface. This weight is a force that squeezes air molecules closer together, increasing both the density and the pressure. Knowing that P = F/A, the previous two expressions are combined to give
\(\ \begin{align} P_{z}=|g| \cdot m_{a b o v e \ z} / A \tag{1.10} \end{align}\)
where A is horizontal cross-section area. Similarly, between two different pressure levels is mass
\(\ \begin{align} \Delta m=(A /|g|) \cdot\left(P_{\text {bottom}}-P_{\text {top}}\right) \tag{1.11} \end{align}\)
Sample Application
Compare the pressures at 10 km above sea level for average temperatures of 250 and 300 K.
Find the Answer
Given: z = 10 km = 104 m
a) T = 250 K, (b) T = 300 K
Find: (a) P = ? kPa, (b) P = ? kPa
a) Use eq. (1.9a):
P=(101.325kPa)·exp[(–0.0342K m–1)·(104m)/250K]
P = 25.8 kPa
(b) P=(101.325kPa)·exp[(–0.0342K m–1)·(104m)/300K]
P = 32.4 kPa
Check: Units OK. Physically reasonable.
Exposition: Pressure decreases slower with height in warmer air because the molecules are further apart.
Some curves never end. In the figure below, curve (a) ends at x = xa. Curve (b) ends at x = xb. But curve (c), the exponentially decreasing curve, asymptotically approaches y = 0, never quite reaching it. The area under each of the curves is finite, and in this example are equal to each other.
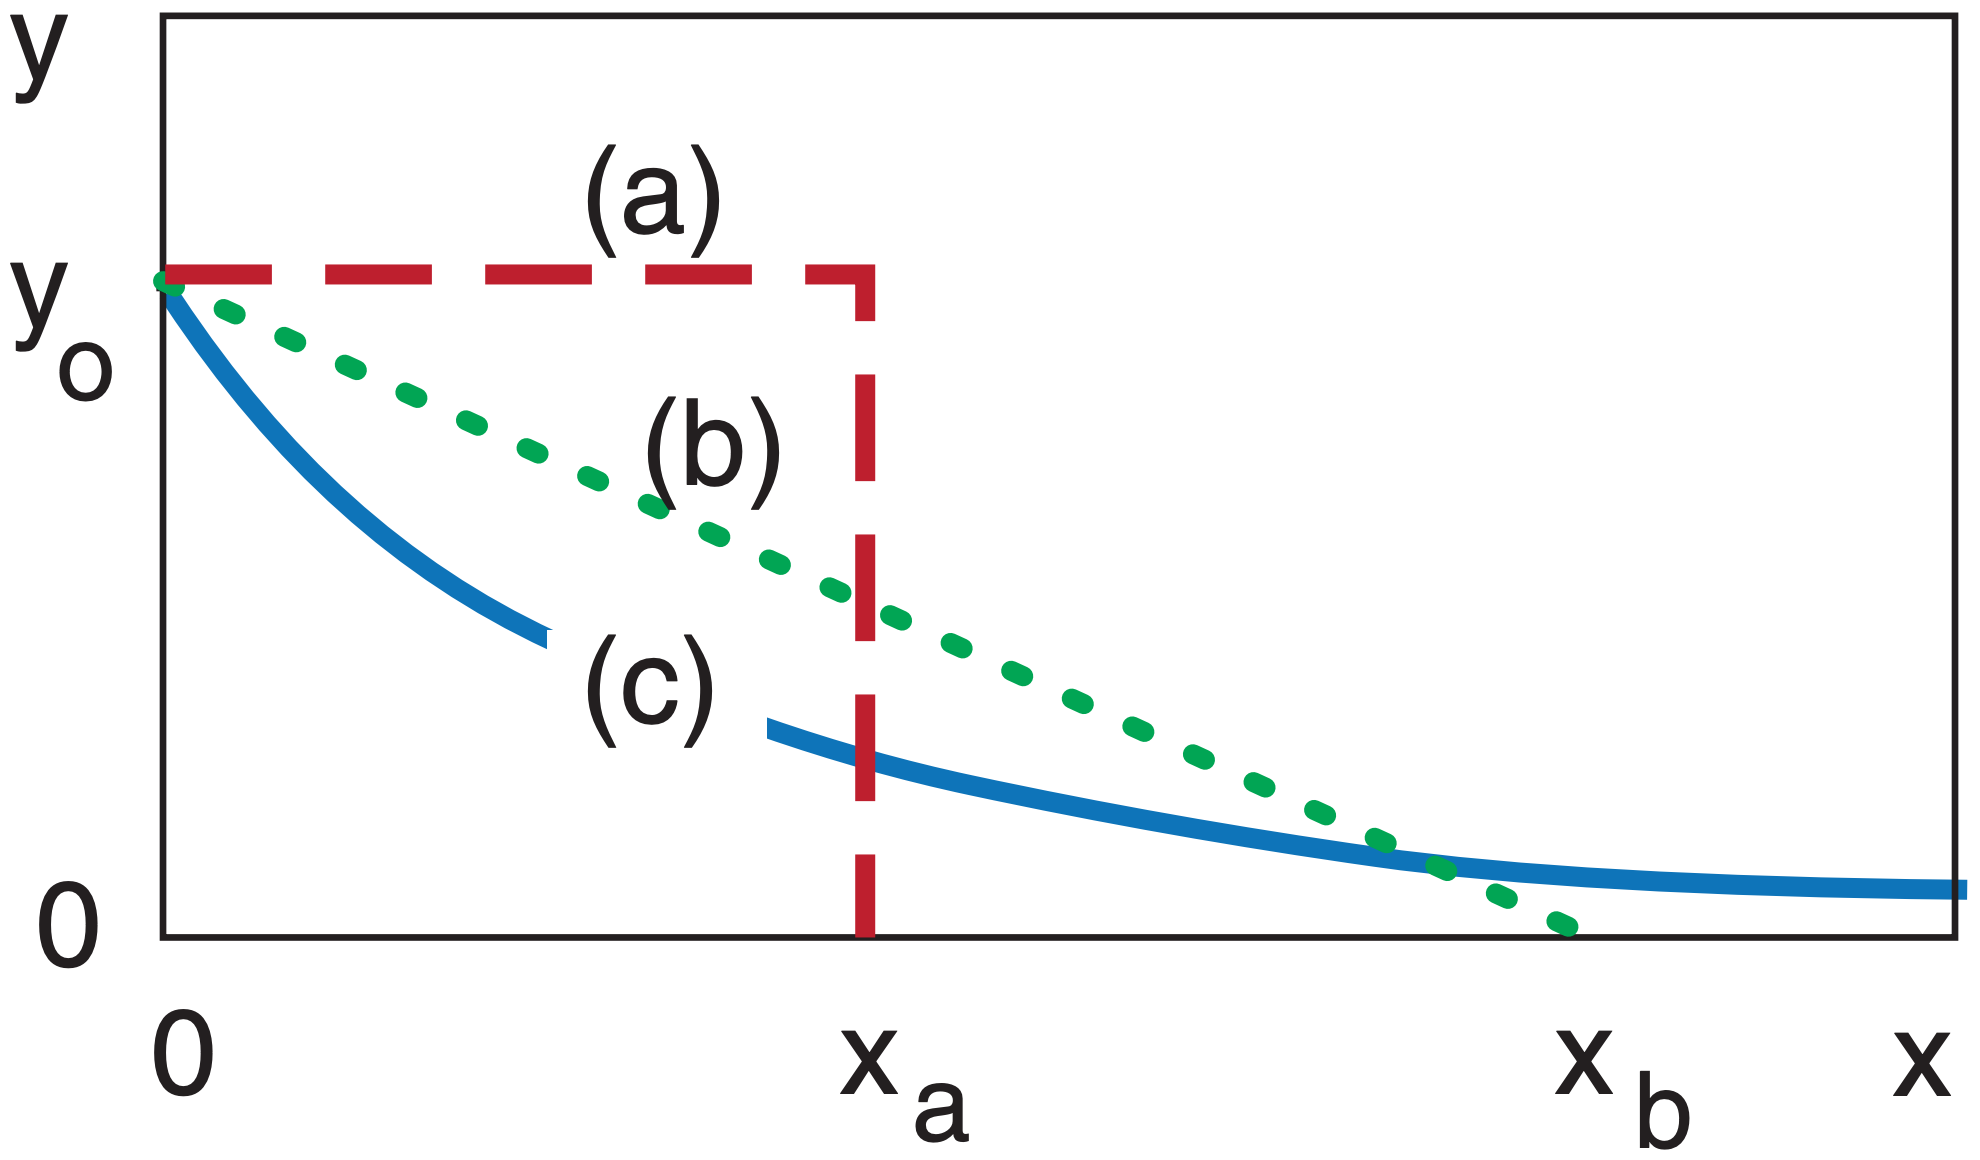
Although the exponential curve never ends, there is another way of quantifying how quickly it decreases with x. That measure is called the e-folding distance (or e-folding time if the independent variable is t instead of x). This is the distance x at which the curve decreases to 1/e of the starting value of the dependent variable, where e = 2.71828 is the base of natural logarithms. Thus, 1/e = 0.368 .
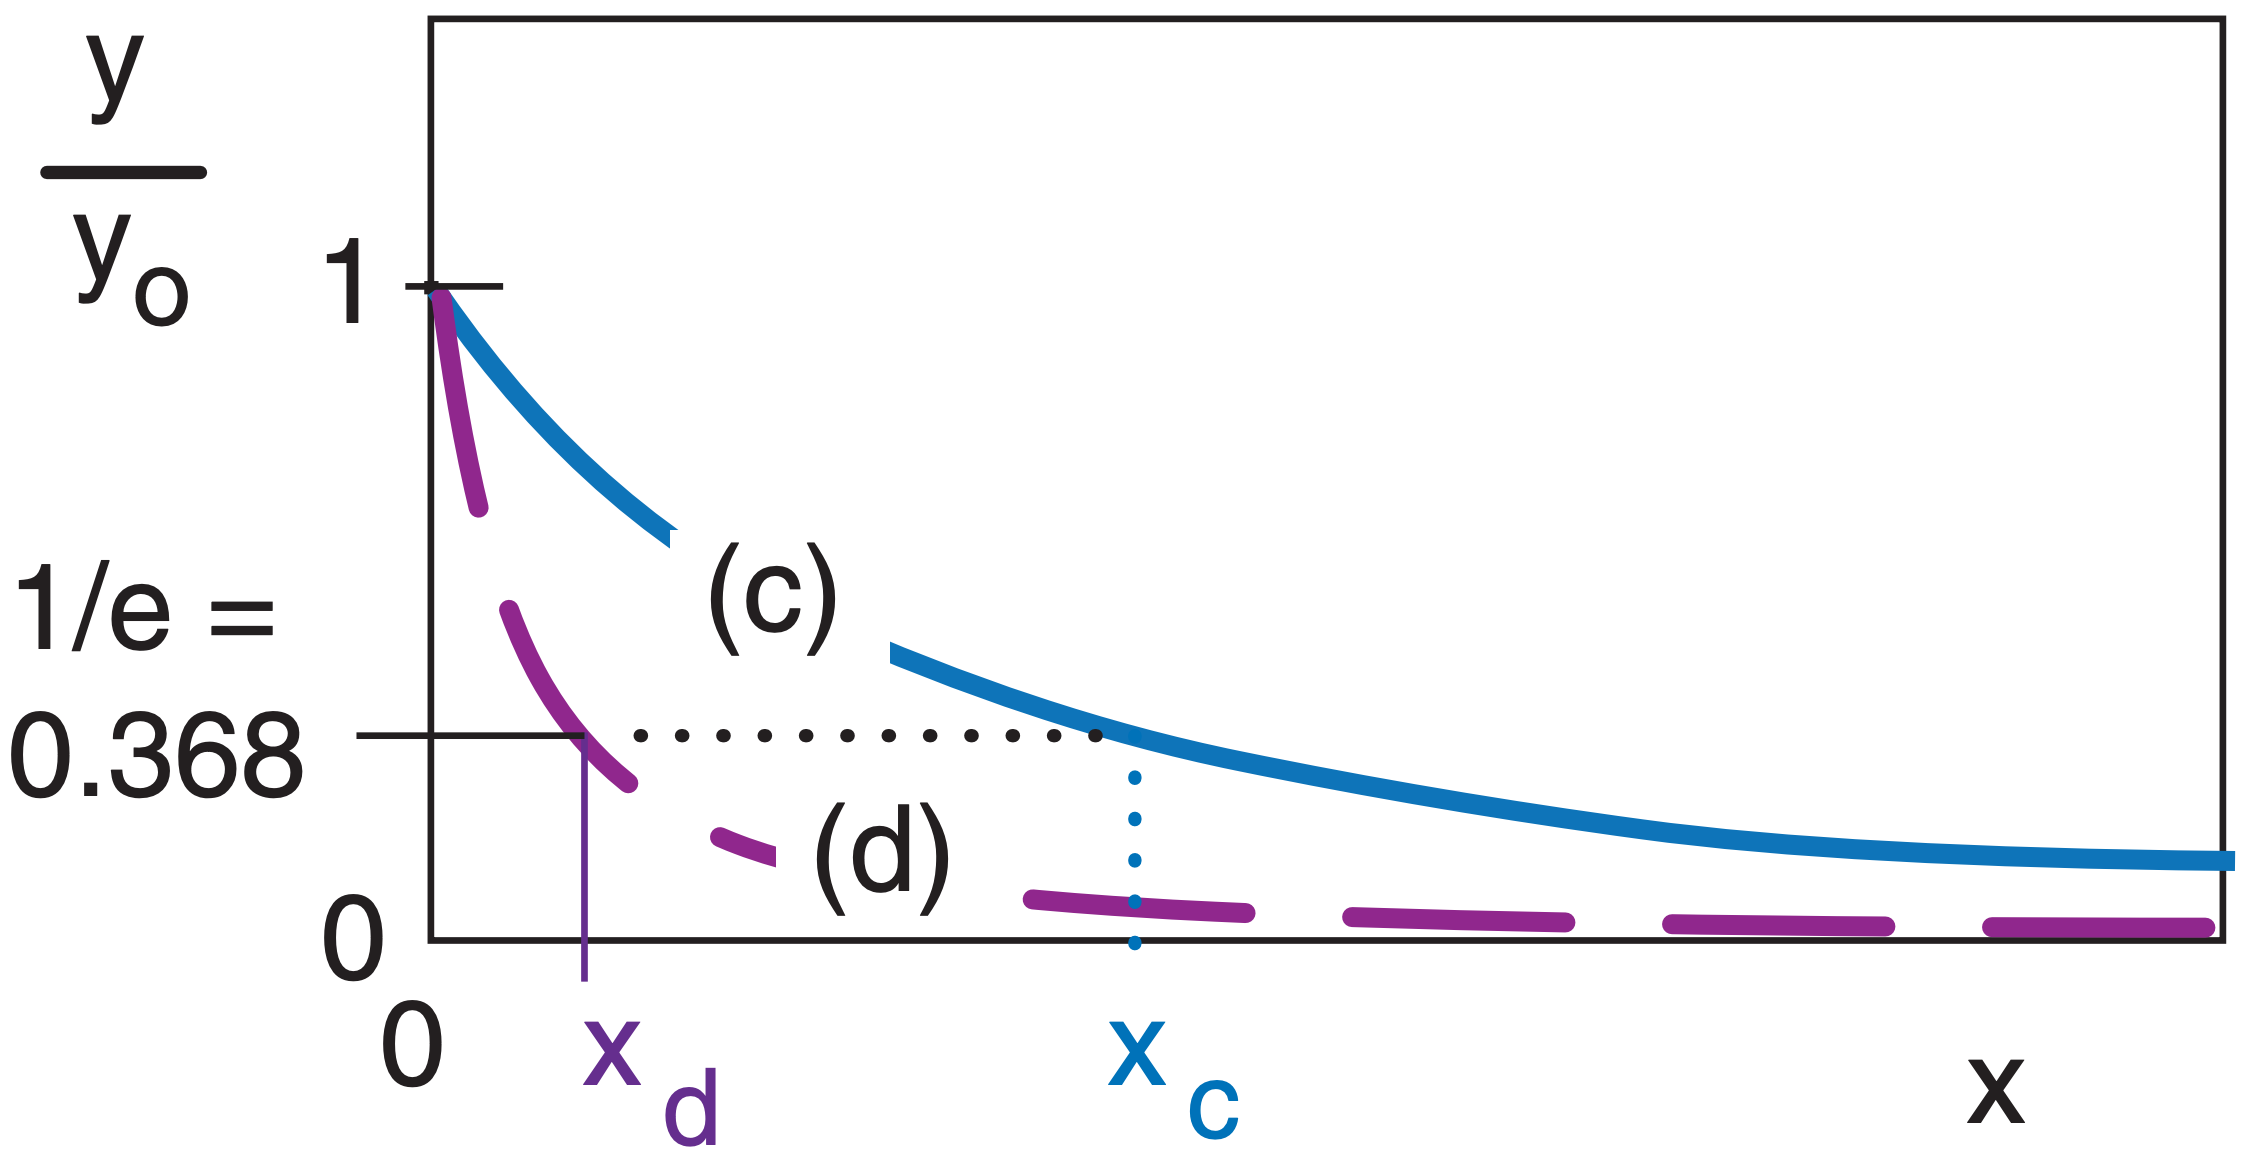
In the example above, both curves (c) and (d) are exponentials, but they drop off at different rates, where xc and xd are their respective e-folding distances. Generically, these curves are of the form:
\(\ y/y_o=e^{-x/x_{efold}}=exp(-x/x_{efold}) \)
Another useful characteristic is that the area A under the exponential curve is A = yo·xefold.
Sample Application
Over each square meter of Earth’s surface, how much air mass is between 80 and 30 kPa?
Find the Answer
Given: Pbottom = 80 kPa, Ptop = 30 kPa, A = 1 m2
Find: ∆m = ? kg
Use eq. (1.11): ∆m = [(1 m2)/(9.8 ms–2)]·(80 – 30 kPa)·
[(1000 kg·m–1·s–2 )/(1 kPa)] = 5102 kg
Check: Units OK. Physics OK. Magnitude OK.
Exposition: About 3 times the mass of a car.
Table 1-4. Standard atmospheric density at sea level, for a standard temperature 15°C.
| Value | Units |
|---|---|
|
1.2250 kg·m–3. 0.076474 lbm ft–3 0.001225 g cm–3 |
kilograms per cubic meter (recommended) pounds-mass per cubic foot grams per liter grams per cubic centimeter |
1.4.3. Density
Density ρ is defined as mass m per unit volume Vol.
\(\ \begin{align}\rho=m/Vol \tag {1.12}\end{align}\)
Density increases as the number and molecular weight of molecules in a volume increase. Average air density at sea level is given in Table 1-4. The recommended unit for density is kg·m–3 .
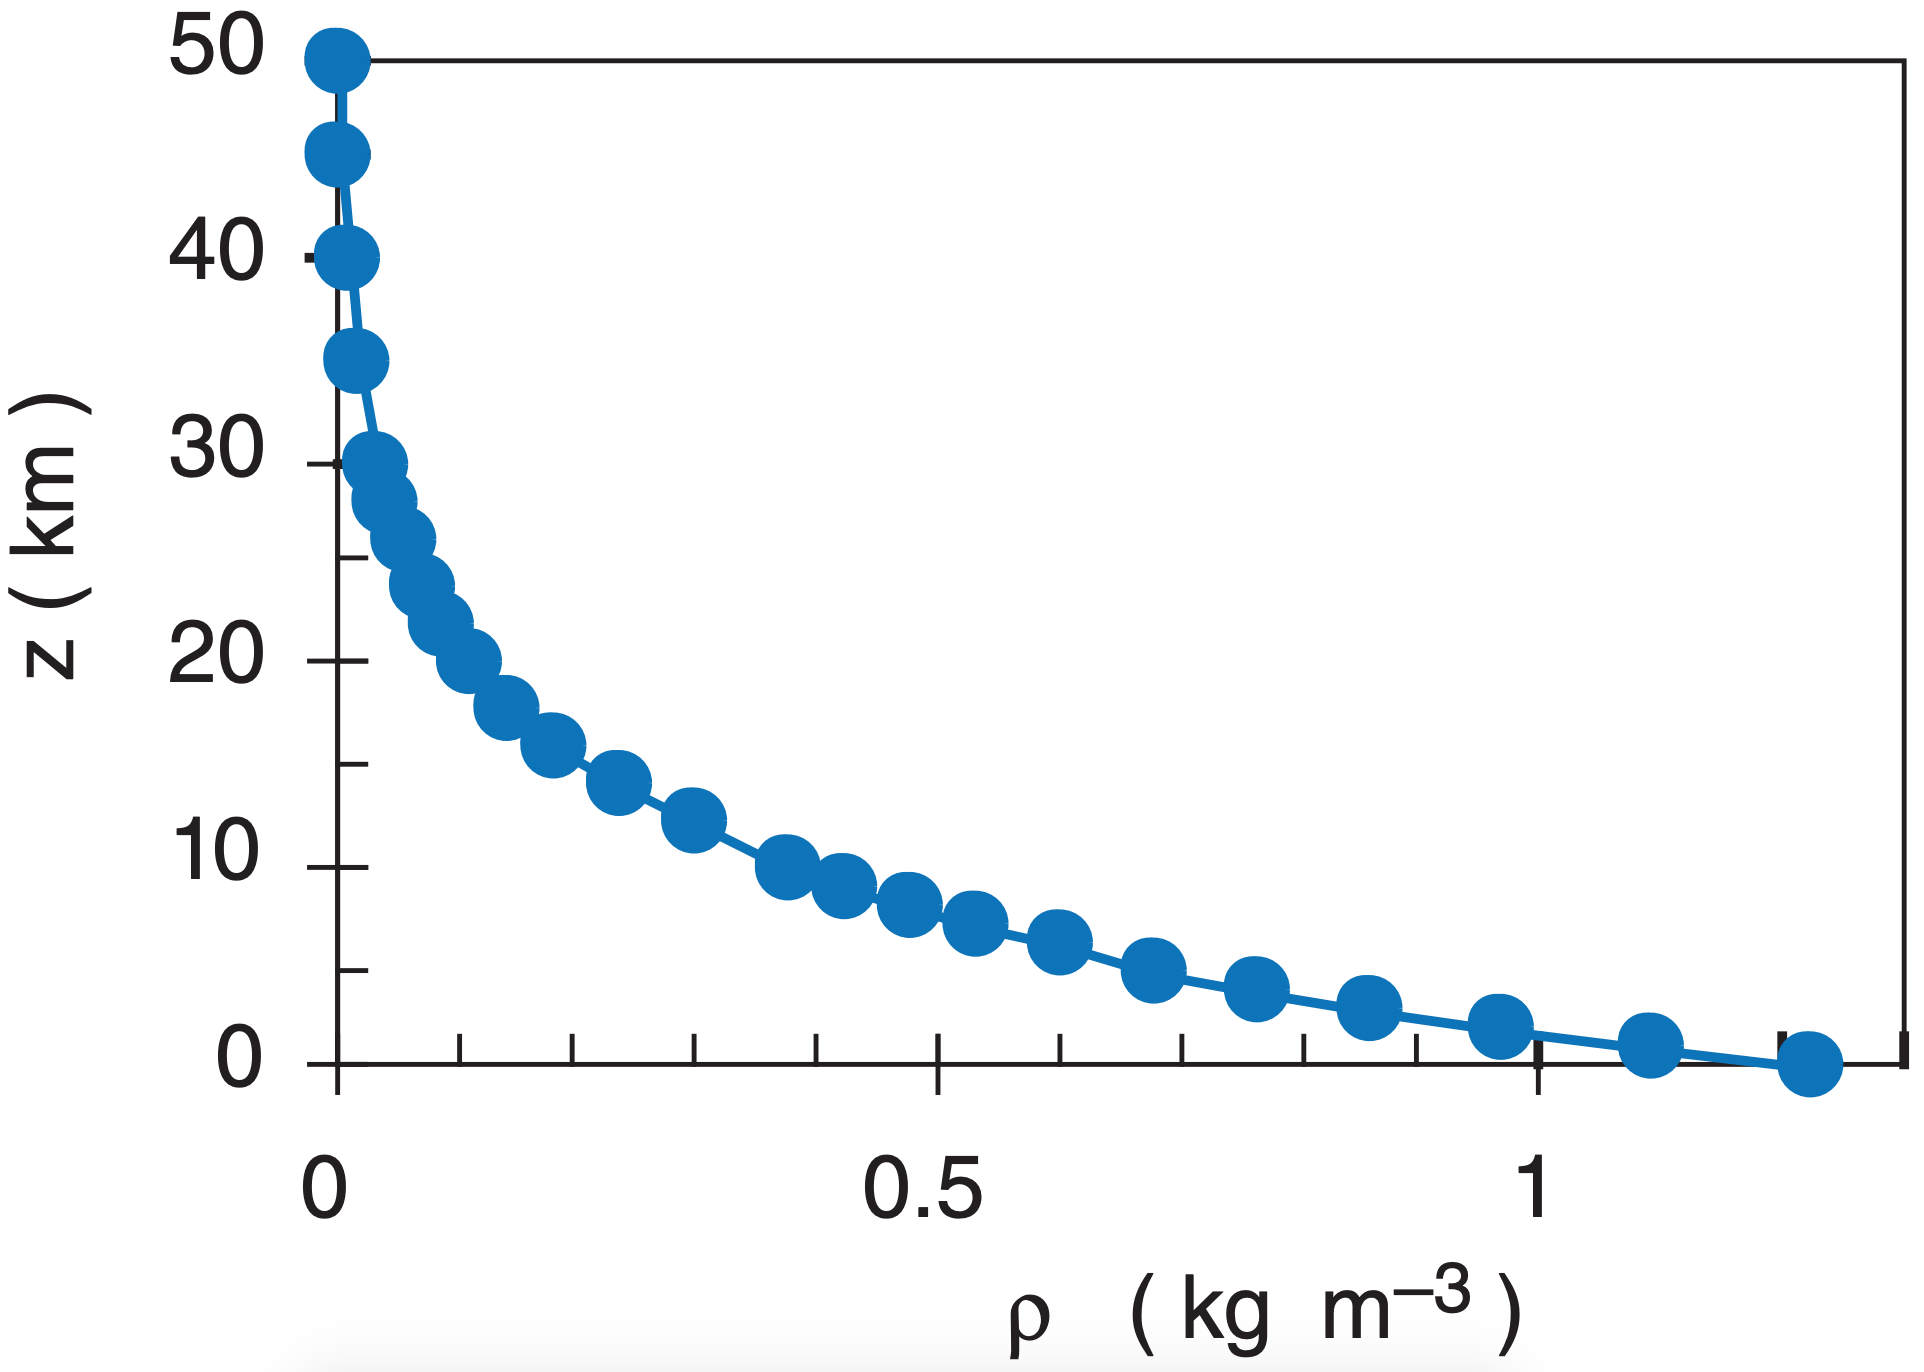
Because gases such as air are compressible, air density can vary over a wide range. Density decreases roughly exponentially with height in an atmosphere of uniform temperature.
\(\ \begin{align}\rho=\rho_o\cdot e^{-(a/T)\cdot z} \tag {1.13a}\end{align}\)
or
\(\ \begin{align}\rho=\rho_o\cdot e^{-z/H_{\rho}} \tag {1.13b}\end{align}\)
where a = 0.040 K m–1, and where average sea-level density is ρo = 1.2250 kg·m–3, at a temperature of 15°C = 288 K. The shape of the curve described by eq. (1.13) is similar to that for pressure, (see Figure 1.9). The scale height for density is Hρ = 8.55 km.
Although the air is quite thin at high altitudes, it still can affect many observable phenomena: twilight (scattering of sunlight by air molecules) up to 63 km, meteors (incandescence by friction against air molecules) from 110 to 200 km, and aurora (excitation of air by solar wind) from 360 to 500 km.
The specific volume (α) is defined as the inverse of density (α = 1/ρ). It has units of volume/mass.
Sample Application
At sea level, what is the mass of air within a room of size 5 m x 8 m x 2.5 m ?
Find the Answer
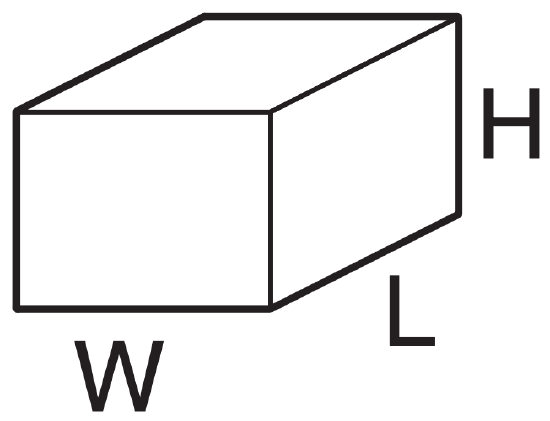 Given: L = 8 m room length, W = 5 m width
H = 2.5 m height of room
ρ = 1.225 kg·m-3 at sea level
Find: m = ? kg air mass
The volume of the room is Vol = W·L·H = (5m)·(8m)·(2.5m) = 100 m3.
Rearrange eq. (1.12) and solve for the mass: m = ρ·Vol. = (1.225 kg·m-3)·(100 m3) = 122.5 kg.
Check: Units OK. Sketch OK. Physics OK.
Exposition: This is 1.5 to 2 times a person’s mass.
Sample Application
What is the air density at a height of 2 km in an atmosphere of uniform temperature of 15°C?
Find the Answer
Given: z =2000 m, ρo =1.225 kg m–3 , T =15°C =288.15 K Find: ρ = ? kg m–3
Use eq. (1.13):
ρ=(1.225 kg m–3)· exp[(–0.04 K m–1)·(2000 m)/288 K]
ρ = 0.928 kg m–3
Check: Units OK. Physics reasonable
Exposition: This means that aircraft wings generate 24% less lift, and engines generate 24% less thrust because of the reduced air density.