
14.7: Thunderstorm Forecasting
- Page ID
- 10242

Forecasting thunderstorms is not easy. Thunderstorm processes are very nonlinear (e.g., thunderstorms grow explosively), and are extremely dependent on initial conditions such as triggering, shear, and static stability. Individual storms are relatively short lived (15 to 30 min), and are constantly changing in intensity and movement during their lifetimes. Intense thunderstorms also modify their environment, making the relationships between pre-storm environments and storm evolution even more challenging to apply.
Much appears to depend on random chance, since we are unable to observe the atmosphere to the precision needed to describe it fully. Will a boundary-layer thermal or an airmass boundary happen to be strong enough to be the first to break through the capping inversion? Will a previous thunderstorm create a strong-enough downburst to trigger a new thunderstorm with its gust front? Will high clouds happen to move over a region, shading the ground and thereby reducing the instability?
Tornadoes, hail, heavy rain, lightning, and strong straight-line wind events may or may not occur, and also vary in intensity, track, and duration within the constraints of the parent thunderstorm. Thunderstorms interact in complex ways with other existing thunderstorms and with the environment and terrain, and can trigger new thunderstorms.
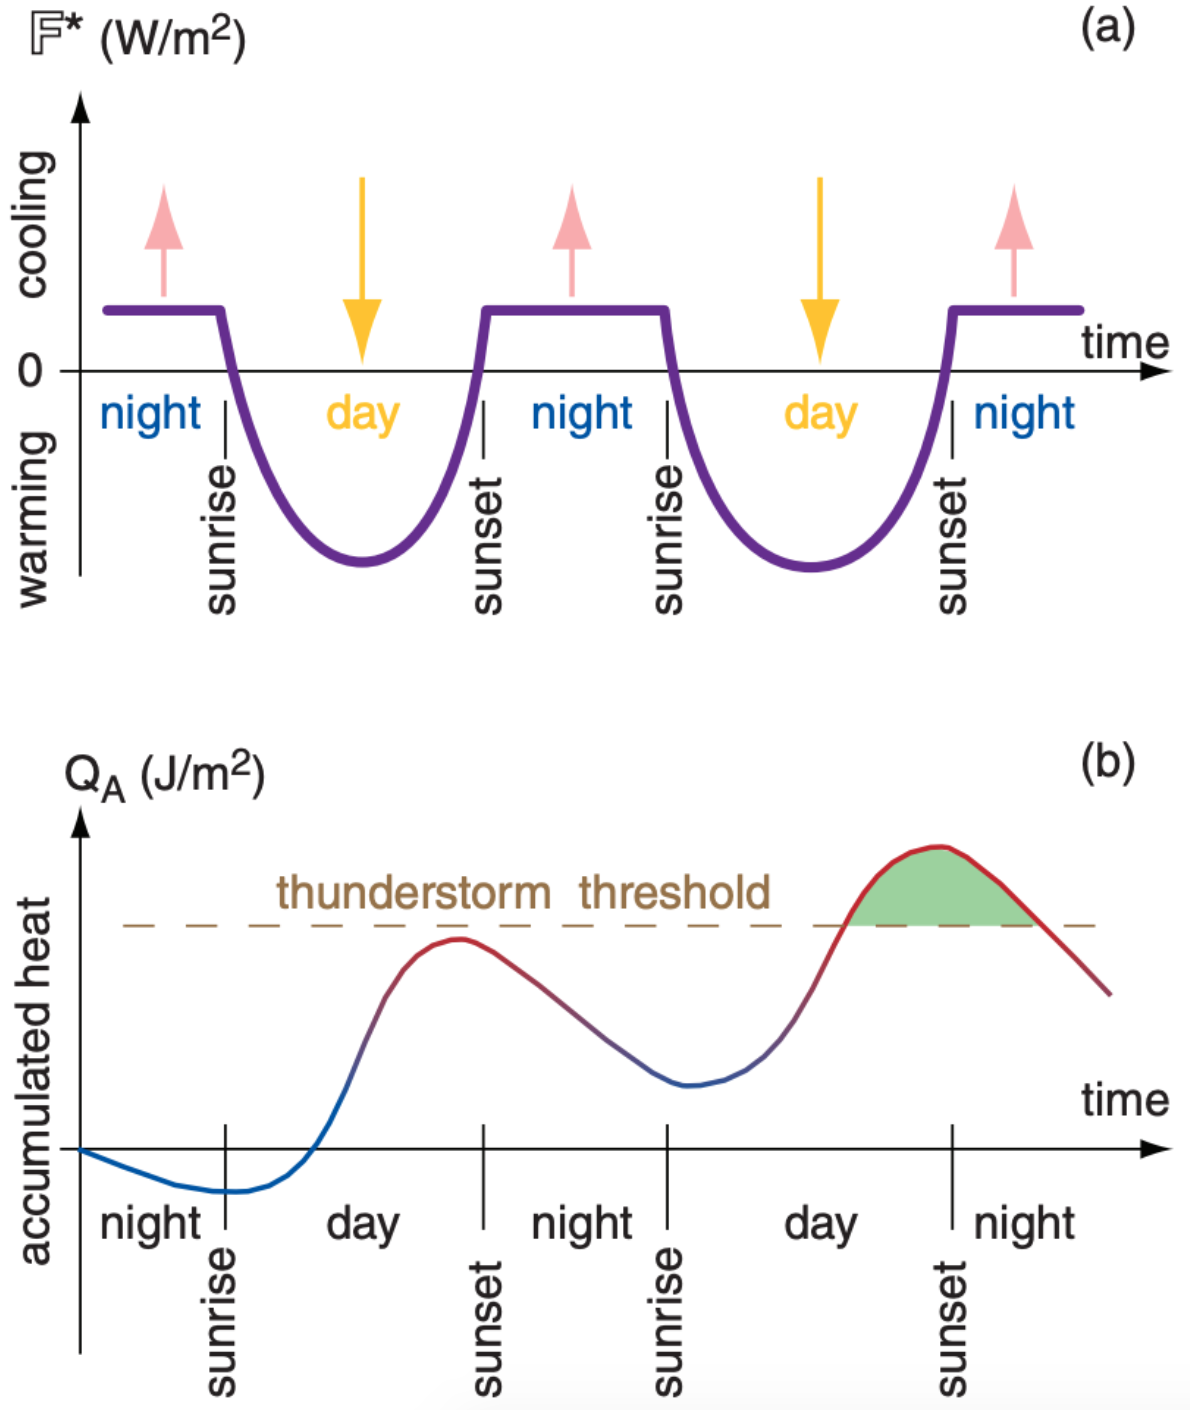
Luckily, most thunderstorms over land have a very marked diurnal cycle, because atmospheric instability is strongly modulated by heating of the ground by the sun. Thunderstorms usually form in mid- to late-afternoon, are most frequent around sunset, and often dissipate during the night. As sketched in Fig. 14.76, the reason is that the greatest accumulation of heat (and moisture) in the boundary layer occurs not at noon, but about a half hour before sunset.
There are notable exceptions to this daily cycle. For example, thunderstorms can be triggered by the Rocky Mountains in late afternoon, and then propagate eastward all night to hit the Midwest USA with the greatest frequency around midnight to early morning.
14.7.1. Outlooks, Watches & Warnings
A thunderstorm is defined as “severe” in the USA if it has one or more of the following:
- tornadoes
- damaging winds (& any winds ≥ 25 m s–1)
- hail with diameter ≥ 1.9 cm
Severe weather (thunderstorm-caused or otherwise) also includes heavy rain that could cause flash flooding. All thunderstorms have lightning, by definition, so lightning is not included in the list of severe weather elements even though it kills more people than tornadoes, hail, or winds.
In the USA, severe convective weather forecasting is broken into three time spans: outlook, watch, and warning. These are defined as follows:
- outlook: a 6 to 72 h forecast guidance for broad regions. Types:
- convective outlooks: very technical
- public severe weather outlooks: plain language
- watch: a 0.5 to 6 h forecast stating that severe weather is favorable within specific regions called watch boxes. Watch types include:
- severe thunderstorm watch (includes tornadoes)
- tornado watch
- warning: a 0 to 1 h forecast stating that severe weather is already occurring and heading your way. Warned are specific towns, counties, transportation corridors, and small regions called warning boxes.
Warning types include:
- severe thunderstorm warning
- tornado warning
Forecast methods for warnings are mostly nowcasts. Namely, wait until the severe weather is already occurring as observed by human spotters or radar signatures, or find other evidence indicating that severe weather is imminent. Then anticipate its movement in the next few minutes, and warn the towns that are in the path.
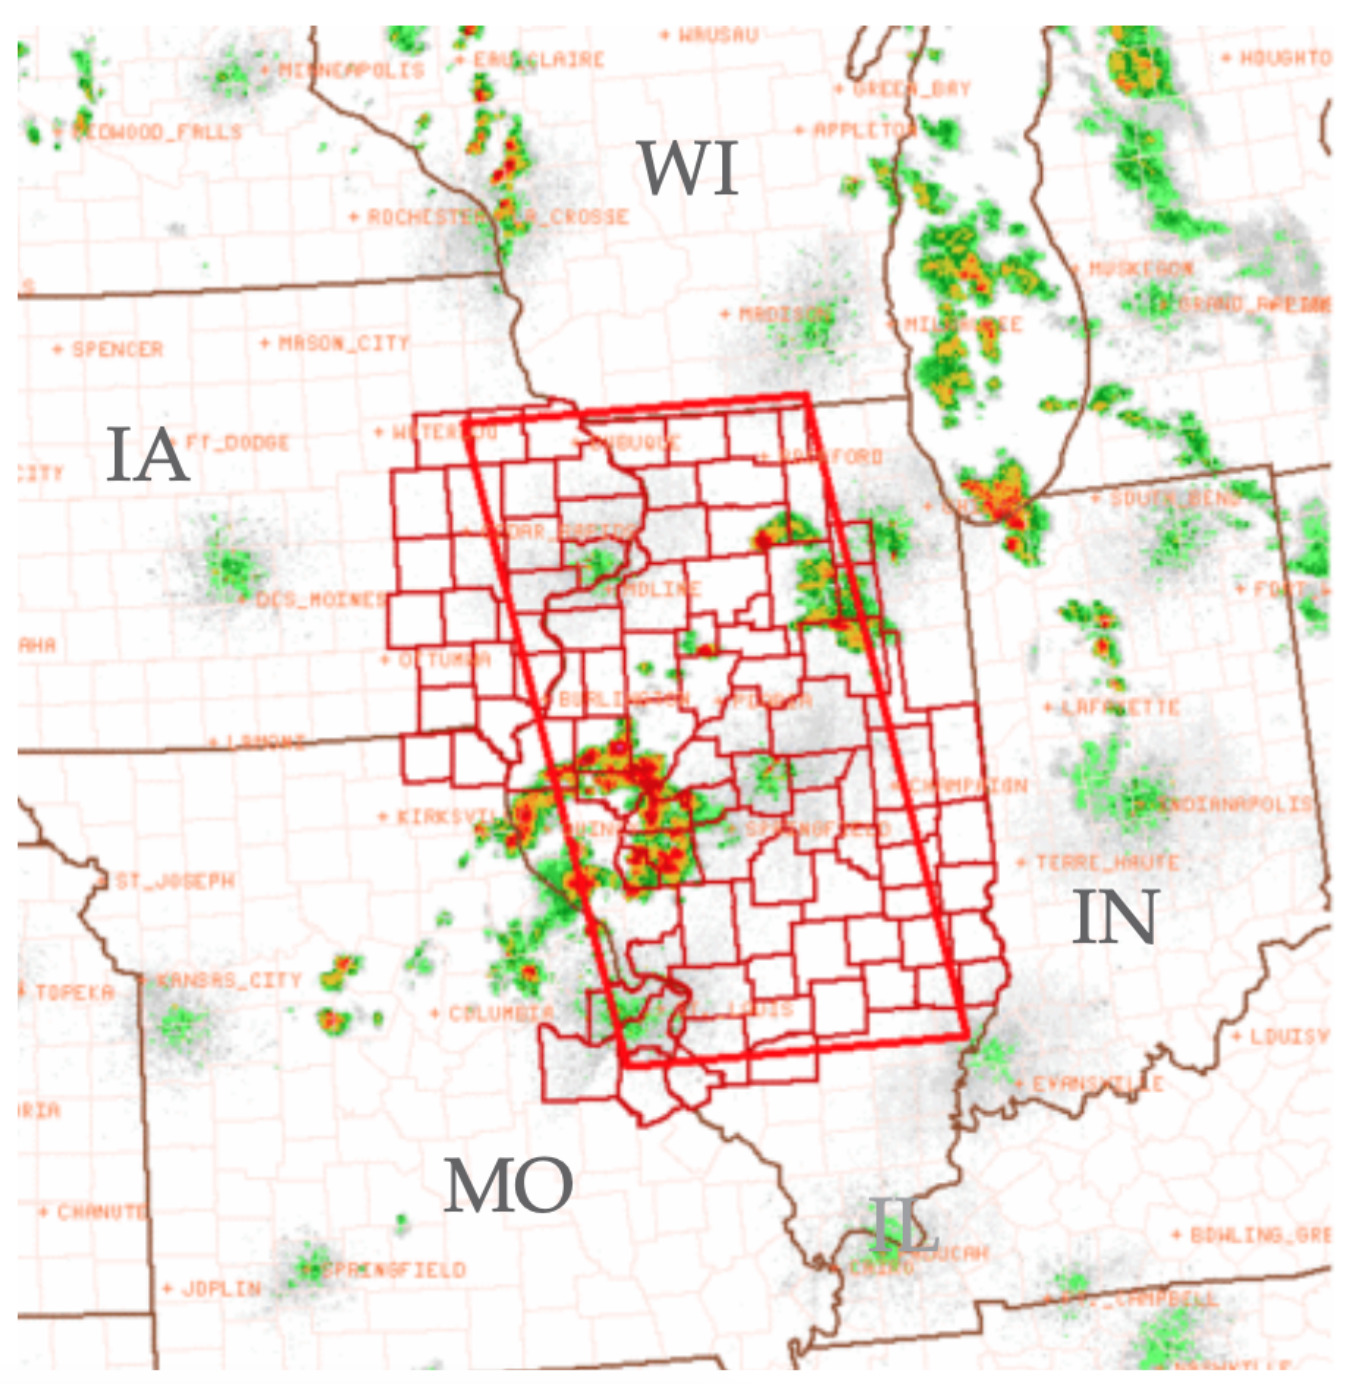
These warnings are delivered by activating civil-defense warning sirens and weather-radio alert messages, by notifying the news media, and by talking with local emergency planners, police and fire agencies. Although the warnings are the most useful because of the details about what, where, and when severe weather will occur or is occurring (Fig 14.77), they are also the shortest term forecasts, giving people only a few minutes to seek shelter. The safest tornado and outflow wind shelters are underground in a basement or a ditch, or in a specially designed reinforced-concrete above-ground safe room.
Methods for forecasting watches are essentially the methods described earlier in this chapter. Namely, short term (0 to 24 h) numerical weather prediction (NWP) model output, soundings from rawinsondes and satellites, and mesoscale analyses of surface weather-station data are analyzed. These analyses focus on the four elements needed for thunderstorm formation later in the day: high humidity in the boundary layer; nonlocal conditional instability; strong wind shear; and a trigger mechanism to cause the initial lifting. The indices and parameters described earlier in this chapter speed the interpretation of the raw data. To handle some of the uncertainty in thunderstorm behavior, probabilistic severe weather forecasts are produced using ensemble methods (see the NWP Chapter).
Nonetheless, watches are somewhat vague, with no ability to indicate which specific towns will be hit and exactly when they will be threatened (the INFO box has an example of a tornado watch and the associated watch box graphic). People in the watch area can continue their normal activities, but should listen to weather reports and/or watch the sky in case storms form nearby. Watches also help local officials prepare for events through changes in staffing of emergency-management and rescue organizations (fire departments, ambulance services, hospitals, police), and deploying storm spotters.
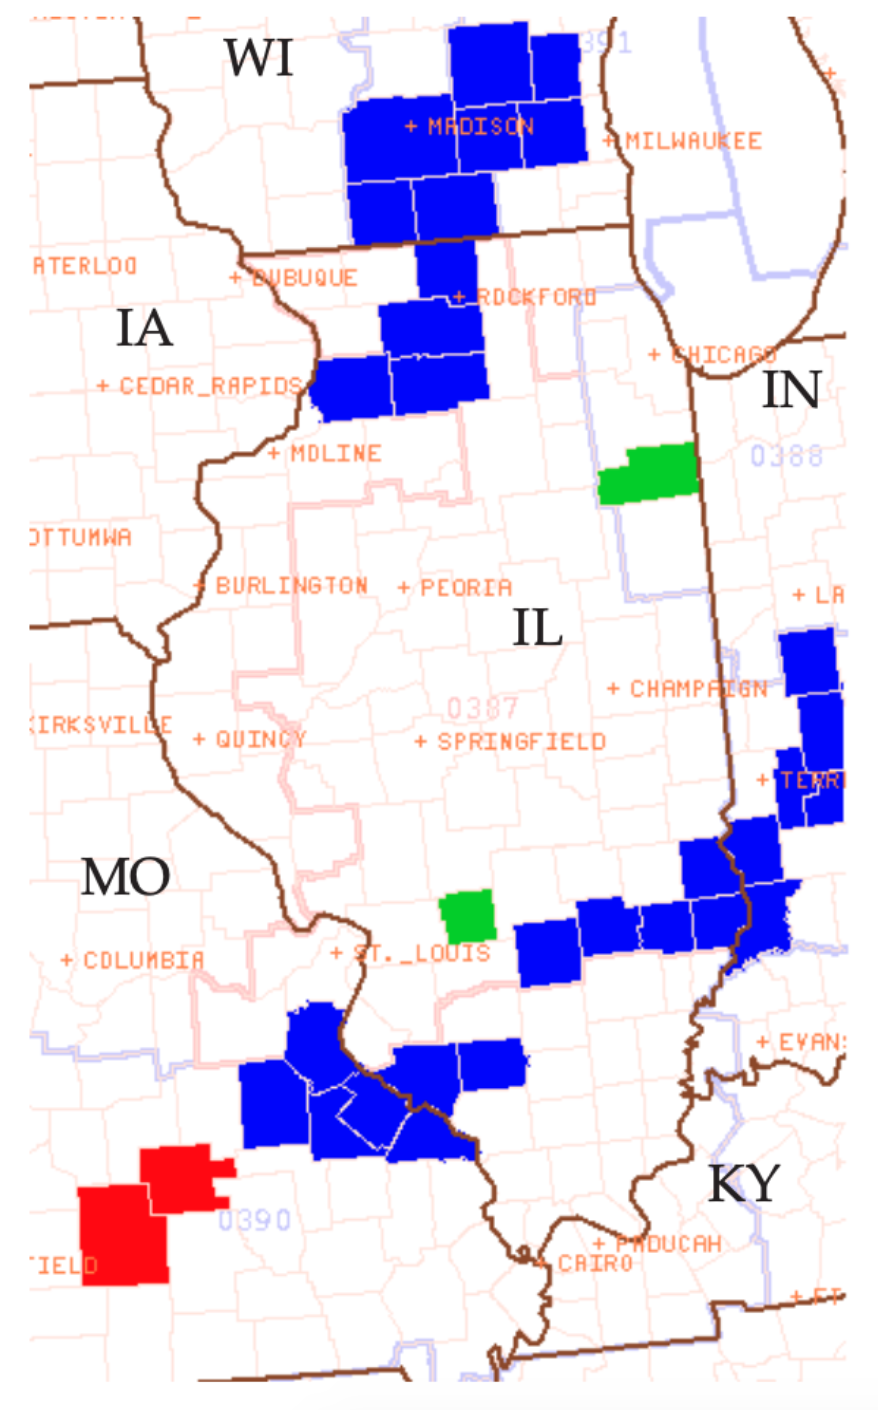
Urgent - immediate broadcast requested
Tornado watch number 387
NWS Storm Prediction Center, Norman OK
245 PM CDT Wed May 24 2006
The NWS Storm Prediction Center has issued a tornado watch for portions of
Eastern Iowa
Central into northeast Illinois
Far east central Missouri
Effective this Wednesday afternoon and evening from 245 PM until 1000 PM CDT.
Tornadoes...Hail to 3 inches in diameter... Thunderstorm wind gusts to 70 mph...And dangerous lightning are possible in these areas.
The tornado watch area is approximately along and 75 statute miles east and west of a line from 30 miles east northeast of Dubuque Iowa to 25 miles southwest of Salem Illinois [see Fig. below]. For a complete depiction of the watch see the associated watch outline update (WOUS64 KWNS WOU7).
Remember...A tornado watch means conditions are favorable for tornadoes & severe thunderstorms in & close to the watch area. Persons in these areas should be on the lookout for threatening weather conditions & listen for later statements and possible warnings.
Other watch info...Continue...WW 385...WW 386...
Discussion...50+ knot westerly mid level jet will spread across far southern Iowa/northern Missouri through the evening and increase shear atop moderate instability already in place across WW. Supercells and organized multicell clusters/lines are expected to evolve and shift from west to east through the mid evening. Large hail could become quite large with stronger cores...With additional isolated tornado threat accompanying more persistent supercells through the evening. Wind damage is also likely.
Aviation...Tornadoes and a few severe thunderstorms with hail surface and aloft to 3 inches. Extreme turbulence and surface wind gusts to 60 knots. A few cumulonimbi with maximum tops to 50,000 ft. Mean storm motion vector from 260° at 25 knots.
[Courtesy of the Storm Prediction Center, US Nat. Weather Service, NOAA.]
| Table 14-5. Alphabetical listing of some thunderstorm (CB) stability indices, compiled from both this chapter and the next chapter. Asterisks (*) indicate indices covered in the next chapter. | ||
| Abbr. | Full Name | Use to anticipate |
|---|---|---|
| BRN | Bulk Richardson Number | CB type |
| BRN Shear | Bulk Richardson Number Shear | tornado likelihood |
|
CAPE |
Convective Available Potential Energy (SB=surface based; ML = mean layer; MU = most unstable; n = normalized) |
CB intensity |
| CIN | Convective Inhibition | strength of cap |
| CPTP | Cloud Physics Thunder Parameter | lightning likelihood |
| DCAPE | Downdraft CAPE* | downburst and gust front intensity |
| EHI | Energy Helicity Index* | supercell intensity tornado intensity |
| LFC | Level of Free Convection | thunderstorm & tornado likelihood |
| ML LCL | Mean-layer Lifting Condensation Level | moisture availability & CB intensity |
| S | Swirl Ratio* | multi-vortex tornadoes |
| SCP | Supercell Composite Parameter* | supercell & tornado intensity |
| SHIP | Significant Hail Parameter* | large-hail likelihood |
| SRH | Storm-Relative Helicity* | mesocyclone rotation |
| STP | Significant Tornado Parameter* | tornado intensity |
| UH | Updraft Helicity* | supercell likelihood & tornado path length |
Convective outlooks include a general statement about the risk that severe weather will occur in broad regions spanning roughly 350 x 350 km, many hours or days into the future. These risk levels are:
- Slight (SLGT): well-organized severe thunderstorms are expected in small numbers and/or low coverage. Specifically: 5 to 29 reports of hail ≥ 2.5 cm, and/or 3 to 5 tornadoes, and/or 5 to 29 wind events having wind speeds ≥ 25 m s–1.
- Moderate (MDT): a greater concentration of severe thunderstorms, and in most situations, greater magnitude of severe weather. Details: ≥ 30 reports of hail ≥ 2.5 cm, or 6 to 19 tornadoes, or numerous wind events (30 that might be associated with a squall line, bow echo or derecho).
- High (HIGH): a major severe-weather outbreak is expected, with great coverage of severe weather and enhanced likelihood of extreme weather (i.e., violent tornadoes or extreme convective wind events over a large area). Details: ≥ 20 tornadoes with at least two rated ≥ EF3, or an extreme derecho causing ≥ 50 widespread high wind events with numerous higher winds ( ≥ 35 m s–1) and structural damage reports.
14.7.2. Stability Indices for Thunderstorms
As you have already seen, meteorologists have devised a wide variety of indices and parameters to help forecast thunderstorm formation, strength, and type. Table 14-5 summarizes indices that were discussed earlier in this chapter as well as indices from the next chapter. Many of these indices integrate over large portions of the environmental sounding or hodograph, and are automatically calculated by computer programs for display next to the computer-plotted sounding.
Because no single index has proved to be the best, new indices are devised, modified, and tested every year. Some day a single best index might be found.
The use of indices to aid severe weather forecasting has a long tradition. Many older indices were devised for calculation by hand, so they use data at a few key altitudes, rather than integrating over the whole sounding. Table 14-6 lists some of the older indices and the associated forecast guidelines.
Table 14-7 compares the values of the different indices with respect to the forecasted weather elements. Beware that this table is highly simplified, and that the boundaries between different severity of storm are not as sharp as the table suggests. Nonetheless, you can use it as a rough guide for interpreting the index values that are often printed with plotted soundings or weather maps.
| Table 14-6. Definition and interpretation of older thunderstorm stability indices. Notation: T = environmental temperature (°C). Td = environmental dew-point temperature (°C). Tps->e = final temperature of an air parcel that started with average conditions at height s and then rose to ending height e following dry adiabat up to LCL, and moist adiabat above. M = wind speed (m s–1). α = wind direction (degrees). Subscripts give pressure altitude. CB = thunderstorms. | |||
| Abbr. | Full Name | Definition | Values & Interpretation |
|---|---|---|---|
| K or KI | K Index | K = T85kPa + Td85kPa + Td70kPa – T70kPa – T50kPa |
< 20 CB unlikely 20 to 30 Chance of scattered CB 30 to 40 Many CB; heavy rain > 40 CB; very heavy rain |
| LI | Lifted Index | LI = T50kPa – Tp95->50kPa |
> 2 CB unlikely 0 to 2 CB only if strong trigger -3 to 0 Weak CB possible -6 to -3 Moderate CB probable < -6 Severe CB likely |
| SSI | Showalter Stability Index | SSI = T50kPa – Tp85->50kPa |
> 3 CB unlikely 1 to 3 Weak showers possible -3 to 0 Severe CB possible -6 to -4 Severe CB probable < -6 Severe CB likely |
| SWEAT | Severe Weather Threat Index |
SWEAT = 12·Td85kPa + 20·(TT – 49) + 4·M85kPa + 2·M50kPa + 125·[0.2 + sin(α50kPa – α85kPa)] where TT = total totals index. Note: more rules set some terms=0 |
< 300 CB unlikely 300-400 Chance isolated severe CB 400-500 Severe CB likely; & tornado possible 500-800 Severe CB & tornado likely |
| TT | Total Totals Index | TT = T85kPa + Td85kPa – 2·T50kPa |
< 45 CB unlikely 45 to 50 Scattered CB possible 50 to 55 CB likely; some severe 55 to 60 Severe CB likely; tornado likely |
| Table 14-7. Approximate relationship between storm indices and storm intensity. | |||||||
| Thunderstorm (CB) & Tornado (EF0 - EF5) Severity | |||||||
|---|---|---|---|---|---|---|---|
| Index | No CB | Ordinary CB | Marginal Supercell | Supercell, no tornado | Supercell & EF0-EF1 | Supercell & EF2-EF5 | Units |
| BRN | 150 | 70 | 30 | 30 | 30 | ||
| BRN Shear | 7 | 30 | 45 | 55 | 70 | m2 s–2 | |
| CAPE (ML) | 950 | 1205 | 1460 | 1835 | 2152 | J·kg–1 | |
| CAPE (MU) | 1750 | 1850 | 1950 | 2150 | 2850 | J·kg–1 | |
| CIN | 18 | 35 | 12 | J·kg–1 | |||
| EHI (ML 0-1km | 0.1 | 0.5 | 0.8 | 1.4 | 2.1 | ||
| K | 15 | 25 | 35 | 45 | °C | ||
| LCL (ML) | 1.75 | 1.47 | 1.34 | 1.18 | 1.00 | km | |
| LI | +1.5 | –1.5 | –4.5 | –7.5 | °C | ||
| SCP | 0 | 1.1 | 3.5 | 5.9 | 11.1 | ||
| Shear (0-6km) | 8 | 15 | 22 | 23 | 24 | m s–1 | |
| SRH (0-1km) | 20 | 70 | 115 | 155 | 231 | m2 s–2 | |
| SRH-effective | 16 | 60 | 117 | 166 | 239 | m2 s–2 | |
| SSI | +4.5 | +1.5 | –1.5 | –4.5 | –7.5 | °C | |
| STP | 0 | 0 | 0.4 | 0.9 | 2.7 | ||
| SWEAT | 300 | 350 | 400 | 450 | 500 | ||
| TT | 42 | 47 | 52 | 57 | 62 | °C | |